The tenant and administrator portals are the operational views. They expose bounded, authorization-aware telemetry without giving browsers direct access to Prometheus or Loki. Grafana is provisioned for deeper operator troubleshooting, not as a customer workflow or the primary platform interface.
Worker observability
Stateful Workers add a dedicated Durable Objects detail tab alongside the ordinary Worker observability views. It reports stable member placement, namespace identity, observed native SQLite object files and storage bytes, plus deployment, recovery, and restart history. The shared shard service exports fixed-cardinality readiness and tenant-scoped namespace/storage metrics; its systemd journal and management spans flow through Alloy to the same platform backends. These values describe native state ownership and lifecycle, not fictional per-object CPU or memory reservations.
Compute → Durable Objects provides the same ownership and lifecycle context across the organization. Compute → Schedules shows trigger state and last delivery outcomes, with links into each Worker’s scheduled invocations and logs. Pausing a schedule stops new delivery, not telemetry collection.
Open a Worker in the console and select Observability. The page provides five focused views instead of mixing every signal into one dashboard:
- Usage summarizes total invocations, failures, background activity, and invocation rate by activation path. This is the closest view of allowance consumption because every supported activation counts as one Worker invocation.
- HTTP shows ingress rate by exact response status and p50/p95/p99 response duration.
- Background shows queue, scheduled, alarm, and custom activations plus queue-handler duration.
- Capacity shows shared runtime-pool CPU and memory for diagnosing platform pressure. It is not per-Worker usage or billing attribution.
- Logs keeps application events and their filters together, with a bounded scroll area and live/pause controls.
Deployment markers remain on the relevant charts. Observability is separate from Worker overview and version detail so traffic history is not confused with an individual deployment artifact.
Time range and version filters apply where the selected view supports them. Invocation type selects runtime activity, while HTTP status and method select ingress traffic. Level and text search are local to Logs. The selected view and all filter state are represented in the URL, so an investigation survives refresh and can be shared or bookmarked.
Use Live to stream recent application logs, then Pause to freeze the view. Resuming catches up from the saved cursor where possible. Live delivery is best effort: it polls stored records every two seconds, limits streams and history, and explicitly indicates gaps. It is not an audit log.
The console authorizes every telemetry request with the current organization’s
workers.read access and Worker scope. One tenant cannot query another
tenant’s traffic, logs, or version history.
What the charts mean
Request counts and durations come from HAProxy completion records collected by
Alloy into Loki. Response duration is HAProxy total active time (Ta) in
milliseconds: it includes Worker execution and response transfer through the
proxy, but not client DNS/TCP setup or a direct Worker CPU measurement.
Request-rate charts draw a zero for known idle intervals. Duration percentiles remain empty when there are no requests, because zero is not a duration sample. Charts show a degraded state when collection health, freshness, or parsing signals fail. Healthy collection is not a guarantee of lossless delivery and these values are not billing counters.
The runtime tail consumer records every invocation’s event type, outcome, queue name, and batch size. That gives queue consumers and other background-only Workers invocation-rate and outcome views without pretending that a queue event is an HTTP request. Queue handler duration is measured independently by the queue service around the complete consumer call, including Worker code and its bindings. Queue histograms are not labeled by deployment version, so the console does not display them while a version filter is active.
The standalone workerd server currently emits zero for legacy tail CPU and
wall-time fields, so the console deliberately does not present those values as
Worker usage. CPU and memory charts show the whole shared runtime pool as
capacity context. Neither can be honestly attributed to a tenant Worker or used
as a quota counter yet.
Application console.* output and uncaught exceptions are exported by a
platform-owned workerd tail consumer after an invocation completes. Messages
may therefore arrive after the response, especially for waitUntil() work.
Application text is untrusted, bounded, and rendered as text; applications
remain responsible for not logging secrets.
Images usage and activity
Media → Images shows organization-scoped operation rate, sampled p95 duration, and recent transformations. These views query structured Images operation logs, not the service’s fleet-wide Prometheus counters. Duration covers the service operation including input and response transfer. Rejections and quota enforcement are visible without being described as platform outages.
The Workers tab lists current bindings, while Activity retains a bounded, paginated view of the latest 200 operations in the selected time window. The monthly quota ledger remains the authoritative usage count; retained telemetry is diagnostic evidence and can cover a different interval.
Platform observability
Platform operators use Platform → Overview for platform-owned volume and service posture, Fleet for host pressure and placed-service readiness, and Events & logs for lifecycle evidence and selected service logs. These views avoid mixing every tenant’s detailed charts into one dense dashboard.
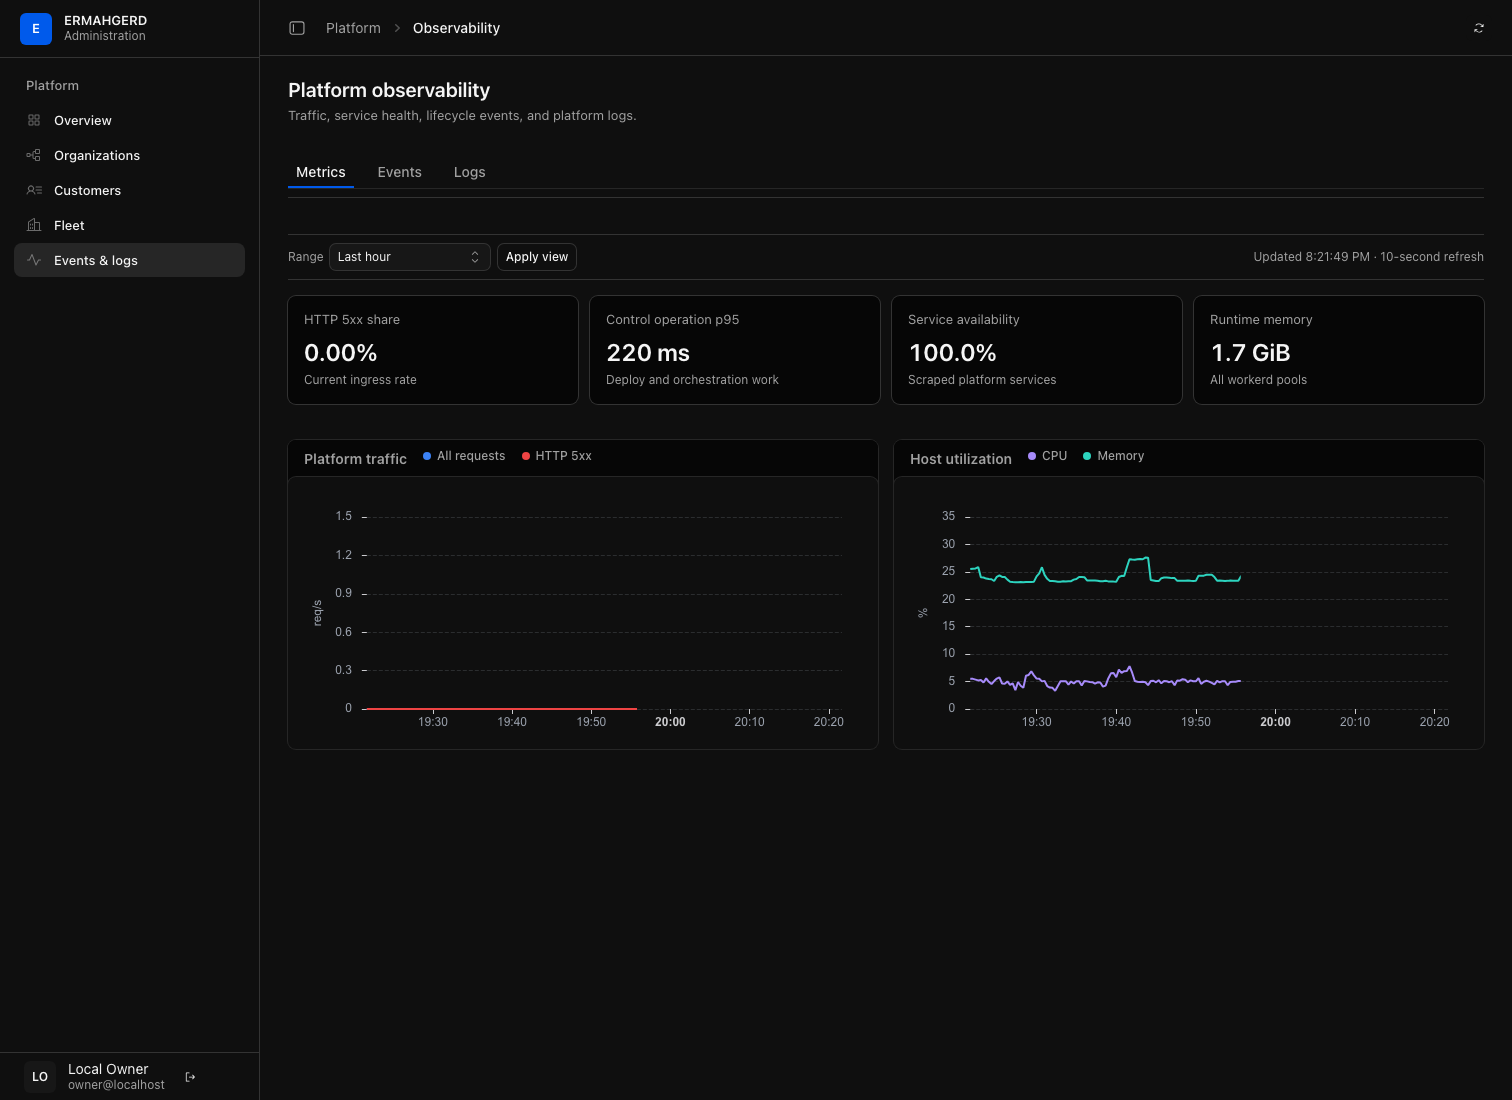
Prometheus, Loki, Tempo, and Grafana are preconfigured for deeper local investigation. Their dashboards are recreated during provisioning, so an operator can investigate a newly created appliance immediately without carrying forward observability data from an older fleet.
The rollout objectives are bounded measurements rather than continuous SLIs. The deterministic compute canary requires 99.99% correct responses within 250 ms. The integrated profile separately requires 99.99% correct R2 write/read-back plus durable queue acceptances within 250 ms. Series are kept distinct by test ID so separate deployment runs are not accidentally merged into a synthetic long-term window.
Queue delivery service level
The current platform objective is: 99.99% of messages accepted by a queue with a configured consumer receive their first delivery attempt no later than the configured batch window plus 250 ms, measured over a rolling 24 hours.
The deadline starts when a durably accepted message becomes eligible for delivery. Requested delivery delay and intentional batch collection time are therefore excluded. A message is evaluated once against its stored deadline; missing messages remain bad events even when no attempt was observed. Retries do not reset the deadline. Consumer execution and acknowledgement latency are shown as context but remain the Worker author’s responsibility and are not part of this scheduling SLI. Queues without a consumer are ineligible rather than counted as failures, and no eligible traffic produces no SLI value rather than a synthetic pass.
Prometheus recording rules calculate 5-minute, 30-minute, 1-hour, 6-hour, and 24-hour windows. Fast-burn and slow-burn alerts are evaluated in Prometheus and shown in Grafana. The appliance does not configure an external Alertmanager, so these alerts are diagnostic state rather than outbound notifications.
Storage service levels
The service-level dashboard has independent read availability and write availability objectives of 99.99% over a rolling 24 hours. Reads enter success counts only after the body completes with the expected length. Writes enter success counts after blob storage and metadata commit succeed. Fast failures, truncated streams, internal exceptions, disk exhaustion, and operations left unfinished by a storage-process restart count as failures. Explicit client cancellations, expected user results such as missing keys or failed conditions, and configured tenant-quota rejections are recorded separately and excluded.
Read first-byte and write finalization objectives currently use candidate
thresholds of 5 ms and 25 ms, respectively. Latency attainment and budgets are
visible, but latency burn alerts are disabled pending baseline evidence.
storage_read_target_ms, storage_write_target_ms, and
storage_latency_slo_enabled control this policy in Ansible. Each latency
series includes its threshold so changing the target does not combine different
policies. Availability burn alerts are enabled immediately.
The service timer starts at the authorized GET/PUT object handler, before its catalog and blob work. First-byte timing ends when the first object-body chunk is available; only one chunk is prefetched, preserving streaming and backpressure. Empty objects use end-of-stream availability. Finalization starts when the last upload byte is consumed and ends at successful acknowledgement preparation. Total duration and transferred bytes remain available to reveal slow uploads, downloads, and storage backpressure. Bytes are exported when an operation settles, not continuously during long transfers.
The current scope is object GET (including ranges) and single PUT through S3, Worker bindings, or the console. HEAD operations are diagnostic only; copy, list, delete, and multipart operations are outside these initial objectives. S3 authentication, ingress transport, and Worker-adapter buffering are outside the service timer and are included in caller measurements. No claim of replicated durability or power-loss safety follows from an acknowledgement SLI.
A separate Durable Object records operation starts and terminal results in SQLite. It resolves unfinished operations as interrupted on the next process invocation, including when the metrics endpoint is the first request after a restart. A running but stuck request remains visible as pending, with an oldest-pending-age alert; it is never counted as successful. Missing storage scrapes have their own coverage alert. Requests that cannot reach the service are outside its counters and must be detected by ingress/probe observations.
Run the isolated storage benchmark with:
make storage-benchmark
STORAGE_ITERATIONS=200 STORAGE_CONCURRENCY=8 make storage-benchmark
It creates a uniquely named probe Worker and bucket, deploys the Worker through Wrangler, and measures S3 and R2 bindings under mixed 4 KiB, 64 KiB, and 1 MiB read/write traffic. Each object is read twice and verified byte-for-byte. The report separates caller first-byte/total latency from exact service-level counter deltas and checks that every measured read/write appears in those counters. This is a closed-loop, configurable-concurrency benchmark, not a fixed-rate traffic profile. Caller measurements include connection setup.
A separate serial phase uses fsync and POSIX_FADV_DONTNEED on only that
run’s probe blobs, then compares cache-advised reads with repeated reads. It
does not drop global caches or touch other buckets. These are not guaranteed
disk-cold measurements: guest eviction is advisory, and host/device caches
are uncontrolled. A short successful run does not establish four-nines
reliability. Evidence is saved under .cache/performance/storage-*/.
Probe objects are individually deleted and temporary credentials revoked; the
empty probe bucket and Worker remain identifiable for inspection.
Collection and retention
Alloy collects VM, process, systemd, runtime cgroup, control-plane, storage, queue, and HAProxy metrics; it forwards selected journals to Loki and OTLP traces to Tempo. Beyla adds eBPF HTTP and network observations for HAProxy and the runtime pool. The control plane emits deployment, validation, activation, proxy-publication, rollback, and recovery events as traces and structured lifecycle records.
Ingress records use a bounded HAProxy ring and guest-loopback RFC5424 transport to Alloy. Paths exclude query strings and are bounded; request bodies, cookies, and authorization headers are not collected. The channel can lose records during collector failures or buffer overflow.
Prometheus retains seven days or 8 GB; Loki and Tempo retain seven days.
Telemetry persists across make down and is discarded with make destroy.
Verify and load test
make observability-check       # verify stored metrics, logs, traces, Grafana
make telemetry-check           # deploy tenant fixtures and check isolation
make load                      # 60 seconds at 10 requests per second
RATE=100 DURATION=120s make load
make load-update               # run both continuity profiles below
make load-sum-update           # compute-only canary across three Wrangler deployments
make load-services-update      # R2 + queues across three Wrangler deployments
make load-sum-update uses the deterministic sum Worker as a platform canary.
Its thresholds require correct responses, no dropped iterations, p95 below
250 ms, p99 below one second, and at least 99.99% correct responses within
250 ms. It deliberately does not make arbitrary tenant Worker response time a
platform SLO. Results, k6 samples, deployment intervals, lifecycle records,
and reports are saved beneath .cache/performance/.
make load-services-update deploys the dedicated rollout-services probe through
Wrangler. At a constant 10 new jobs/second, each HTTP invocation writes a unique
R2 object, reads it back for correctness, then durably enqueues a job. The queue
handler reads the same object, verifies its document, writes an idempotent receipt,
and acknowledges. Both handlers belong to the deployed Worker, so the three
revisions exercise HTTP and native queue delivery cutovers while work is pending.
Receipt polling adds HTTP traffic beyond the 10 job submissions/second.
The services probe has its own 99.99%-within-250-ms acceptance check; it does not feed the compute-only canary SLI. Queue completion is measured separately: every accepted job must have a matching receipt within 10 seconds, and queue counters must reconcile with accepted jobs after draining. Reports include R2 round-trip and enqueue latency, receipt-observation p50/p95/p99/max, retries, consumer version counts, and queue backlog/oldest-age snapshots taken approximately every second. Receipt latency includes the 200-ms polling interval and R2 read, not just handler execution. These are bounded, synthetic regression checks, not a general promise about arbitrary application latency or exactly-once delivery.
The service profile uses the test-only rollout-probes bucket/queue and
rollout-probes-dlq, refuses to start with pending primary-queue work or a foreign
consumer, and serializes local runs. It never purges existing messages. Objects
are retained under run-specific probes/services-rollout-<id>-<iteration>/
prefixes for diagnosis. Do not use these fixture names for application data.
Detailed reconciliation is in services-report.json; queue-samples.json and
the usual k6, Loki, Tempo, and Prometheus artifacts share its run directory.
RATE, DURATION, DEPLOY_COUNT, and DEPLOY_INTERVAL_SECONDS configure either
profile. Leave enough duration after the last deployment to observe its handlers.