These views separate the three architectural questions that matter most when working on the host: who owns deployment state, where traffic is allowed to flow, how capacity is placed, how tenancy is authorized, and how runtime behavior is observed.
The .d2 files are the editable sources. The adjacent PNG files are generated
artifacts for GitHub and other Markdown renderers; do not edit them directly.
Run make diagrams after changing a source file.
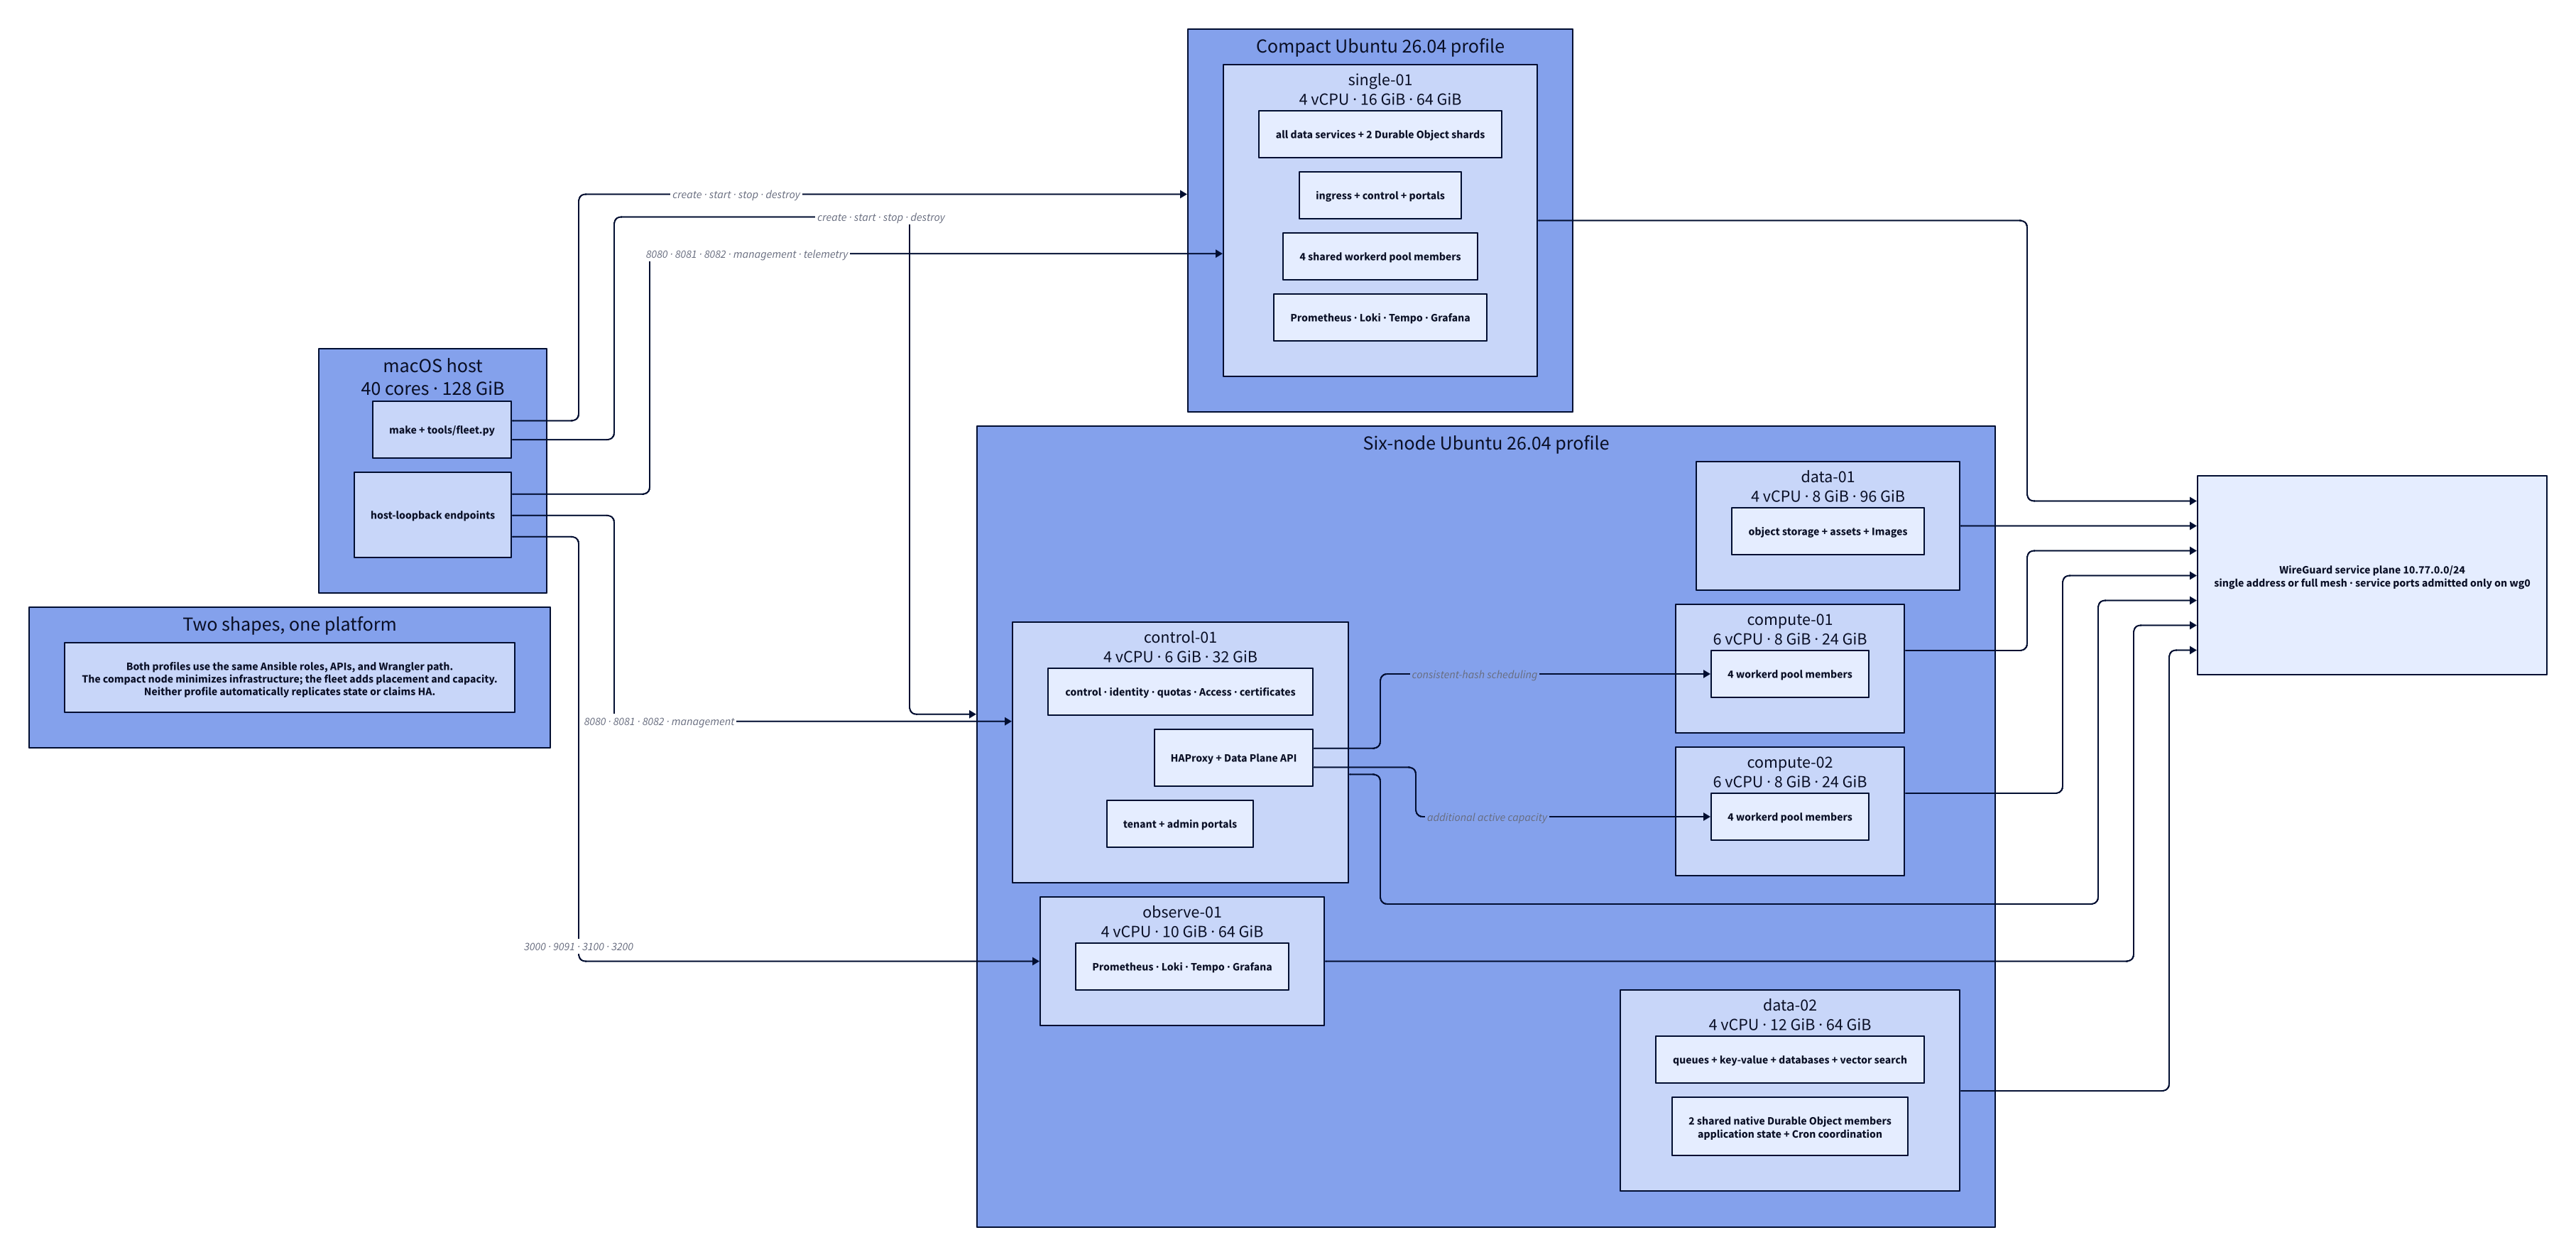
Deployment profile placement
This view contrasts the complete compact node with the six-node capacity profile. Both run the same platform; the fleet’s additional nodes are independent scheduling and placement targets, not HA mirrors.
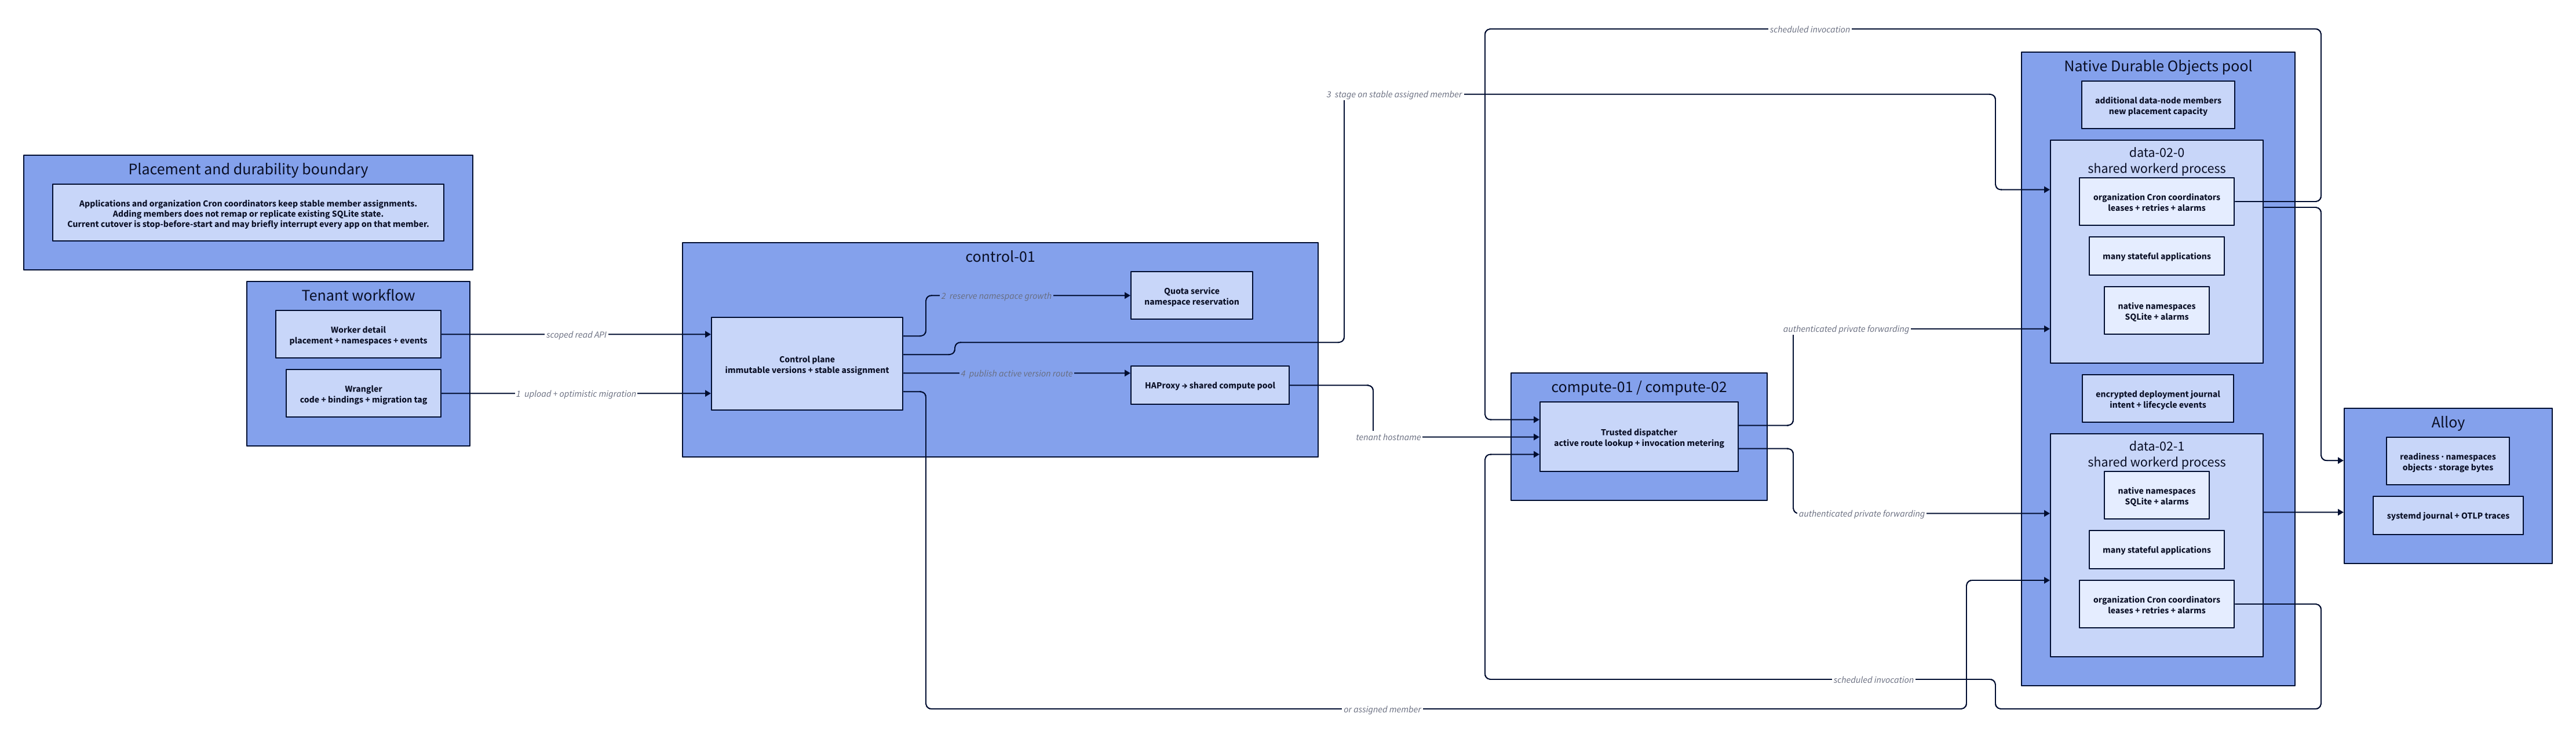
Native Durable Objects
This view separates Wrangler migration orchestration from request forwarding and native object ownership. It shows stable shared-shard placement, SQLite state, quota enforcement, and the current non-HA, stop-before-start cutover boundary.
Control-plane orchestration
This view follows a Wrangler deployment from the workstation through the API, durable desired state, fixed-pool readiness, and HAProxy publication. It also shows certificate desired state and safe ingress publication, the startup recovery direction, and the ownership boundary between Ansible and Wrangler.

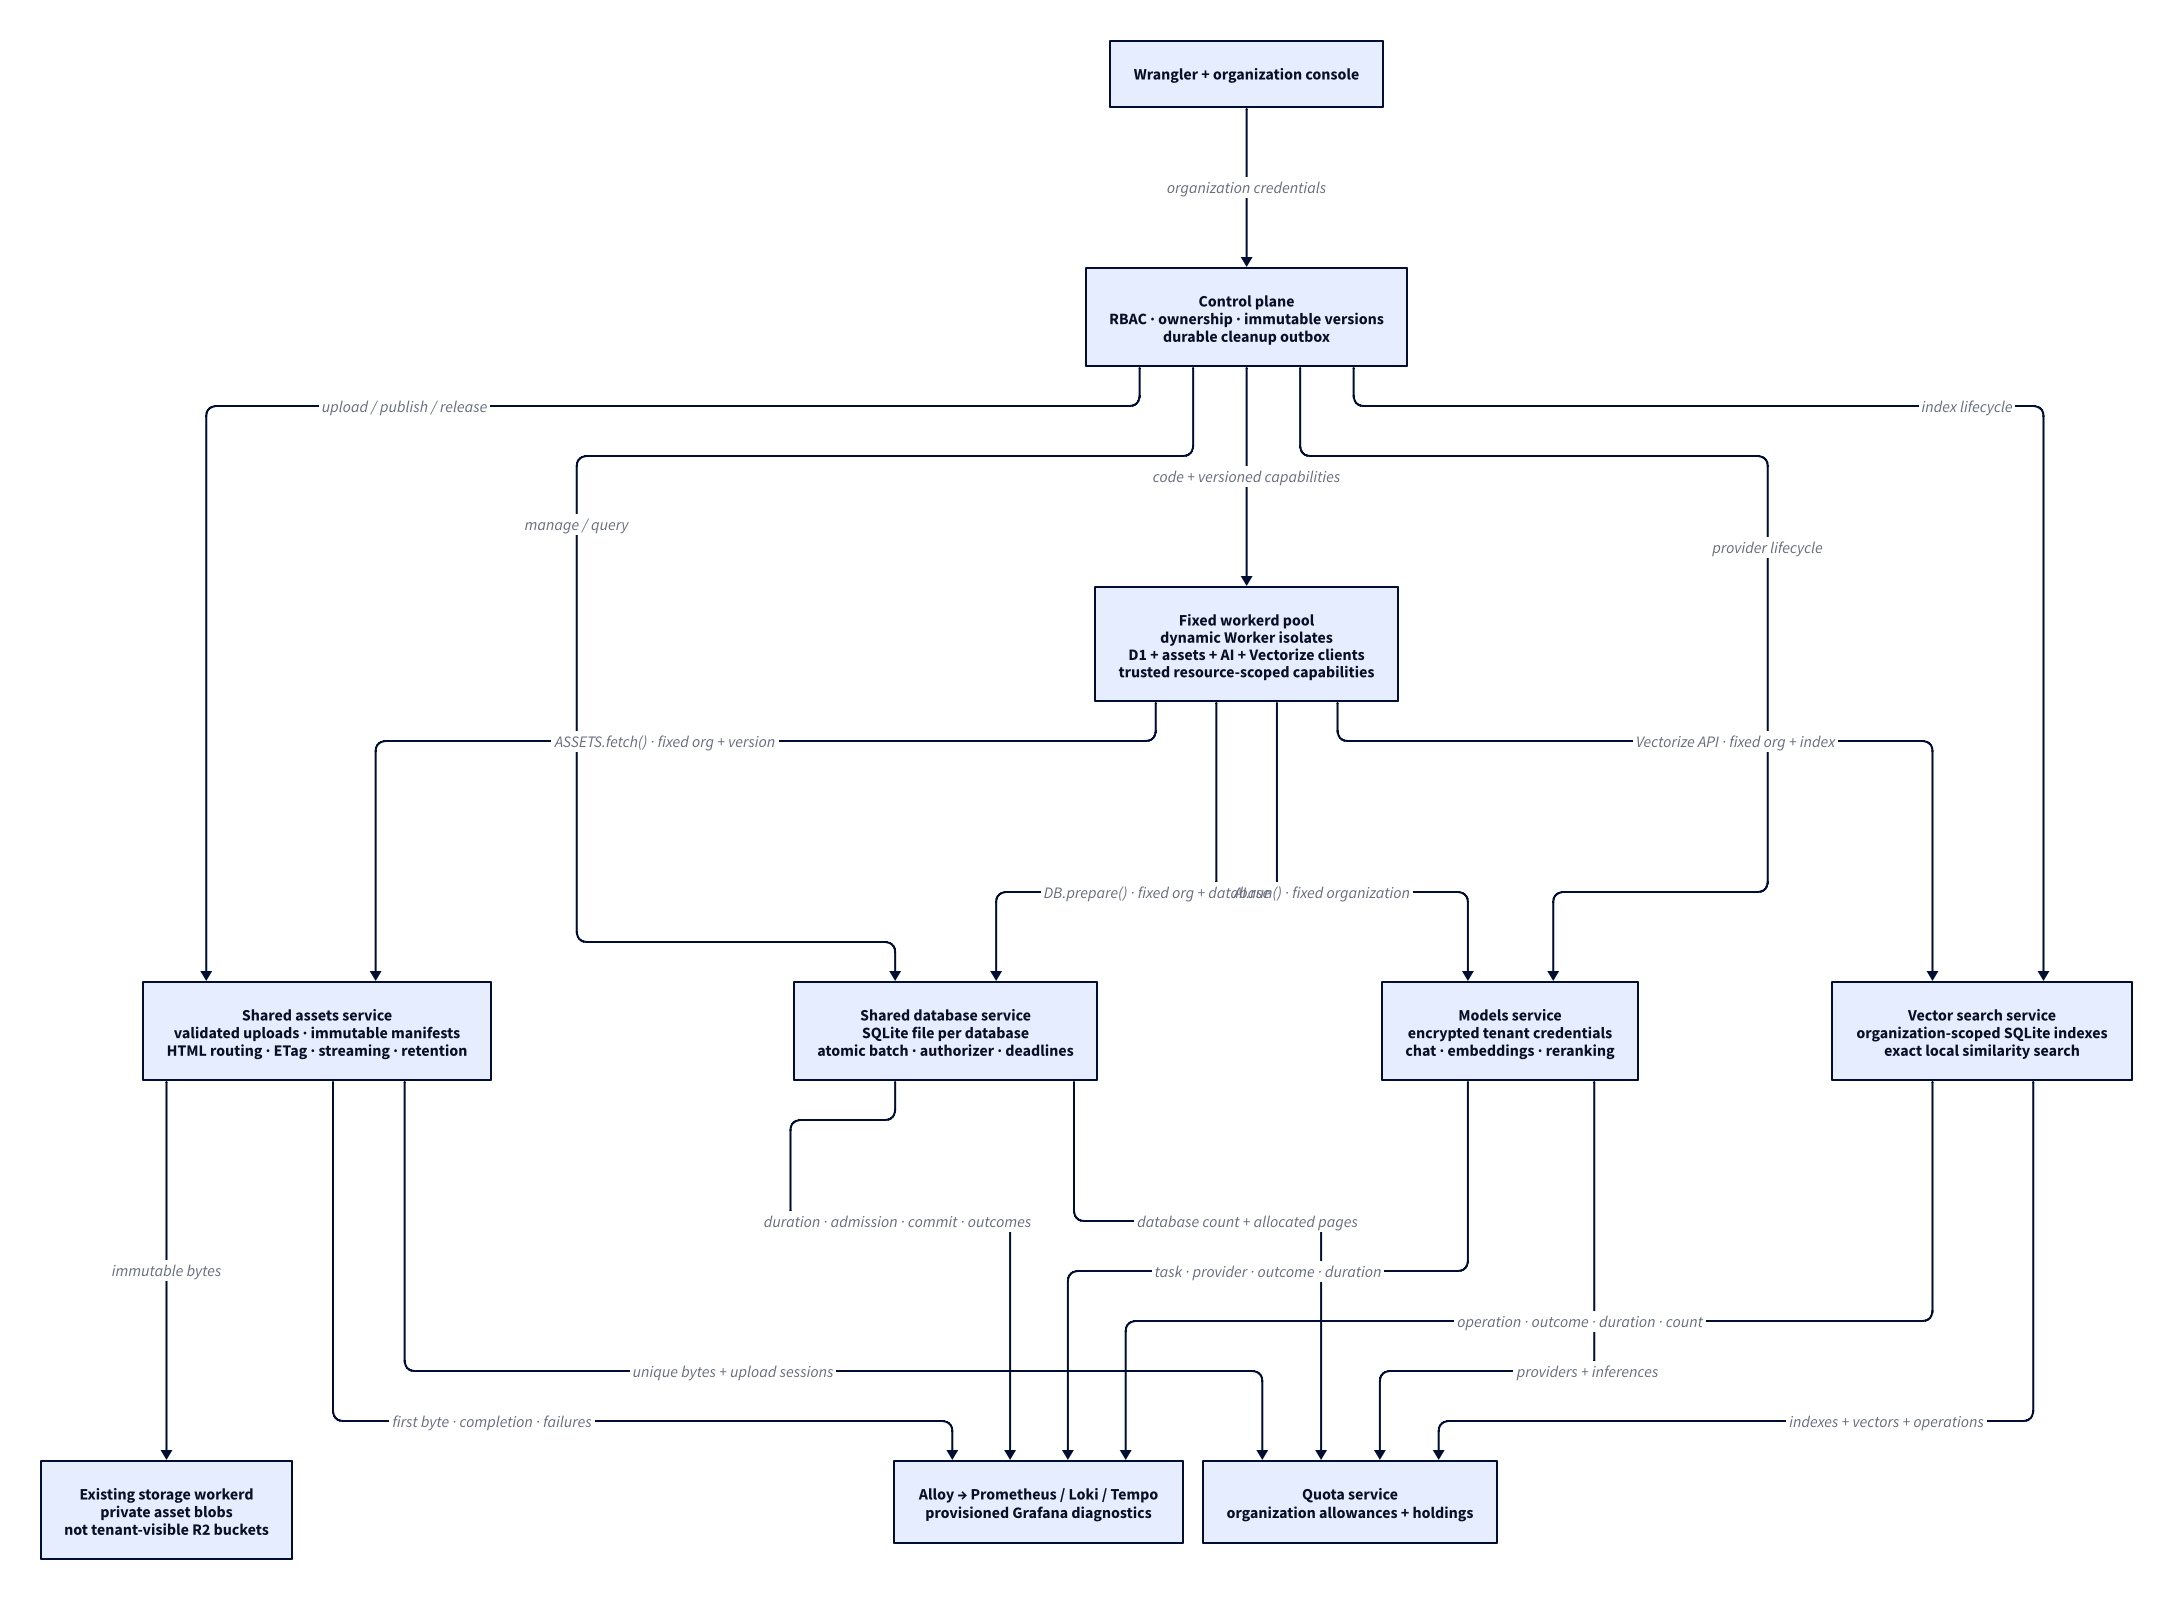
Databases and static assets
Shared service boundaries, tenant-scoped capabilities, storage reuse, and quota ownership are shown separately from the temporal release sequence.
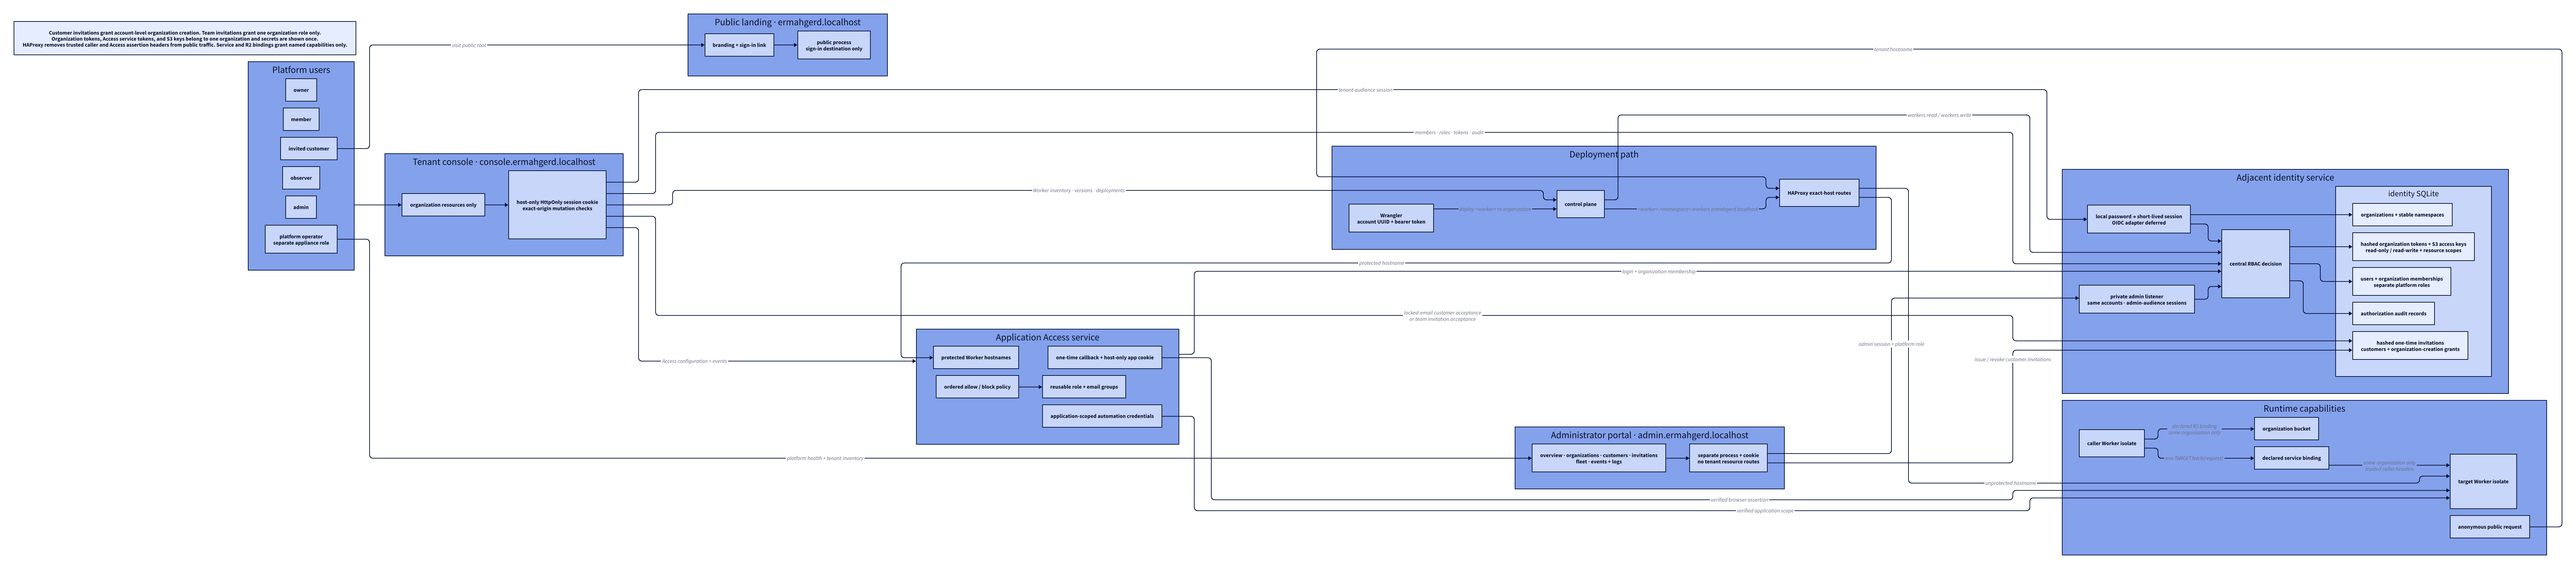
Tenancy and authorization
This view separates local user authentication, organization membership roles, organization-owned API tokens, control-plane authorization, tenant subdomains, the customer and team invitation boundaries, the browser console, and explicit Worker-to-Worker service capabilities. OIDC user sign-in is a future adapter and is not shown as implemented.
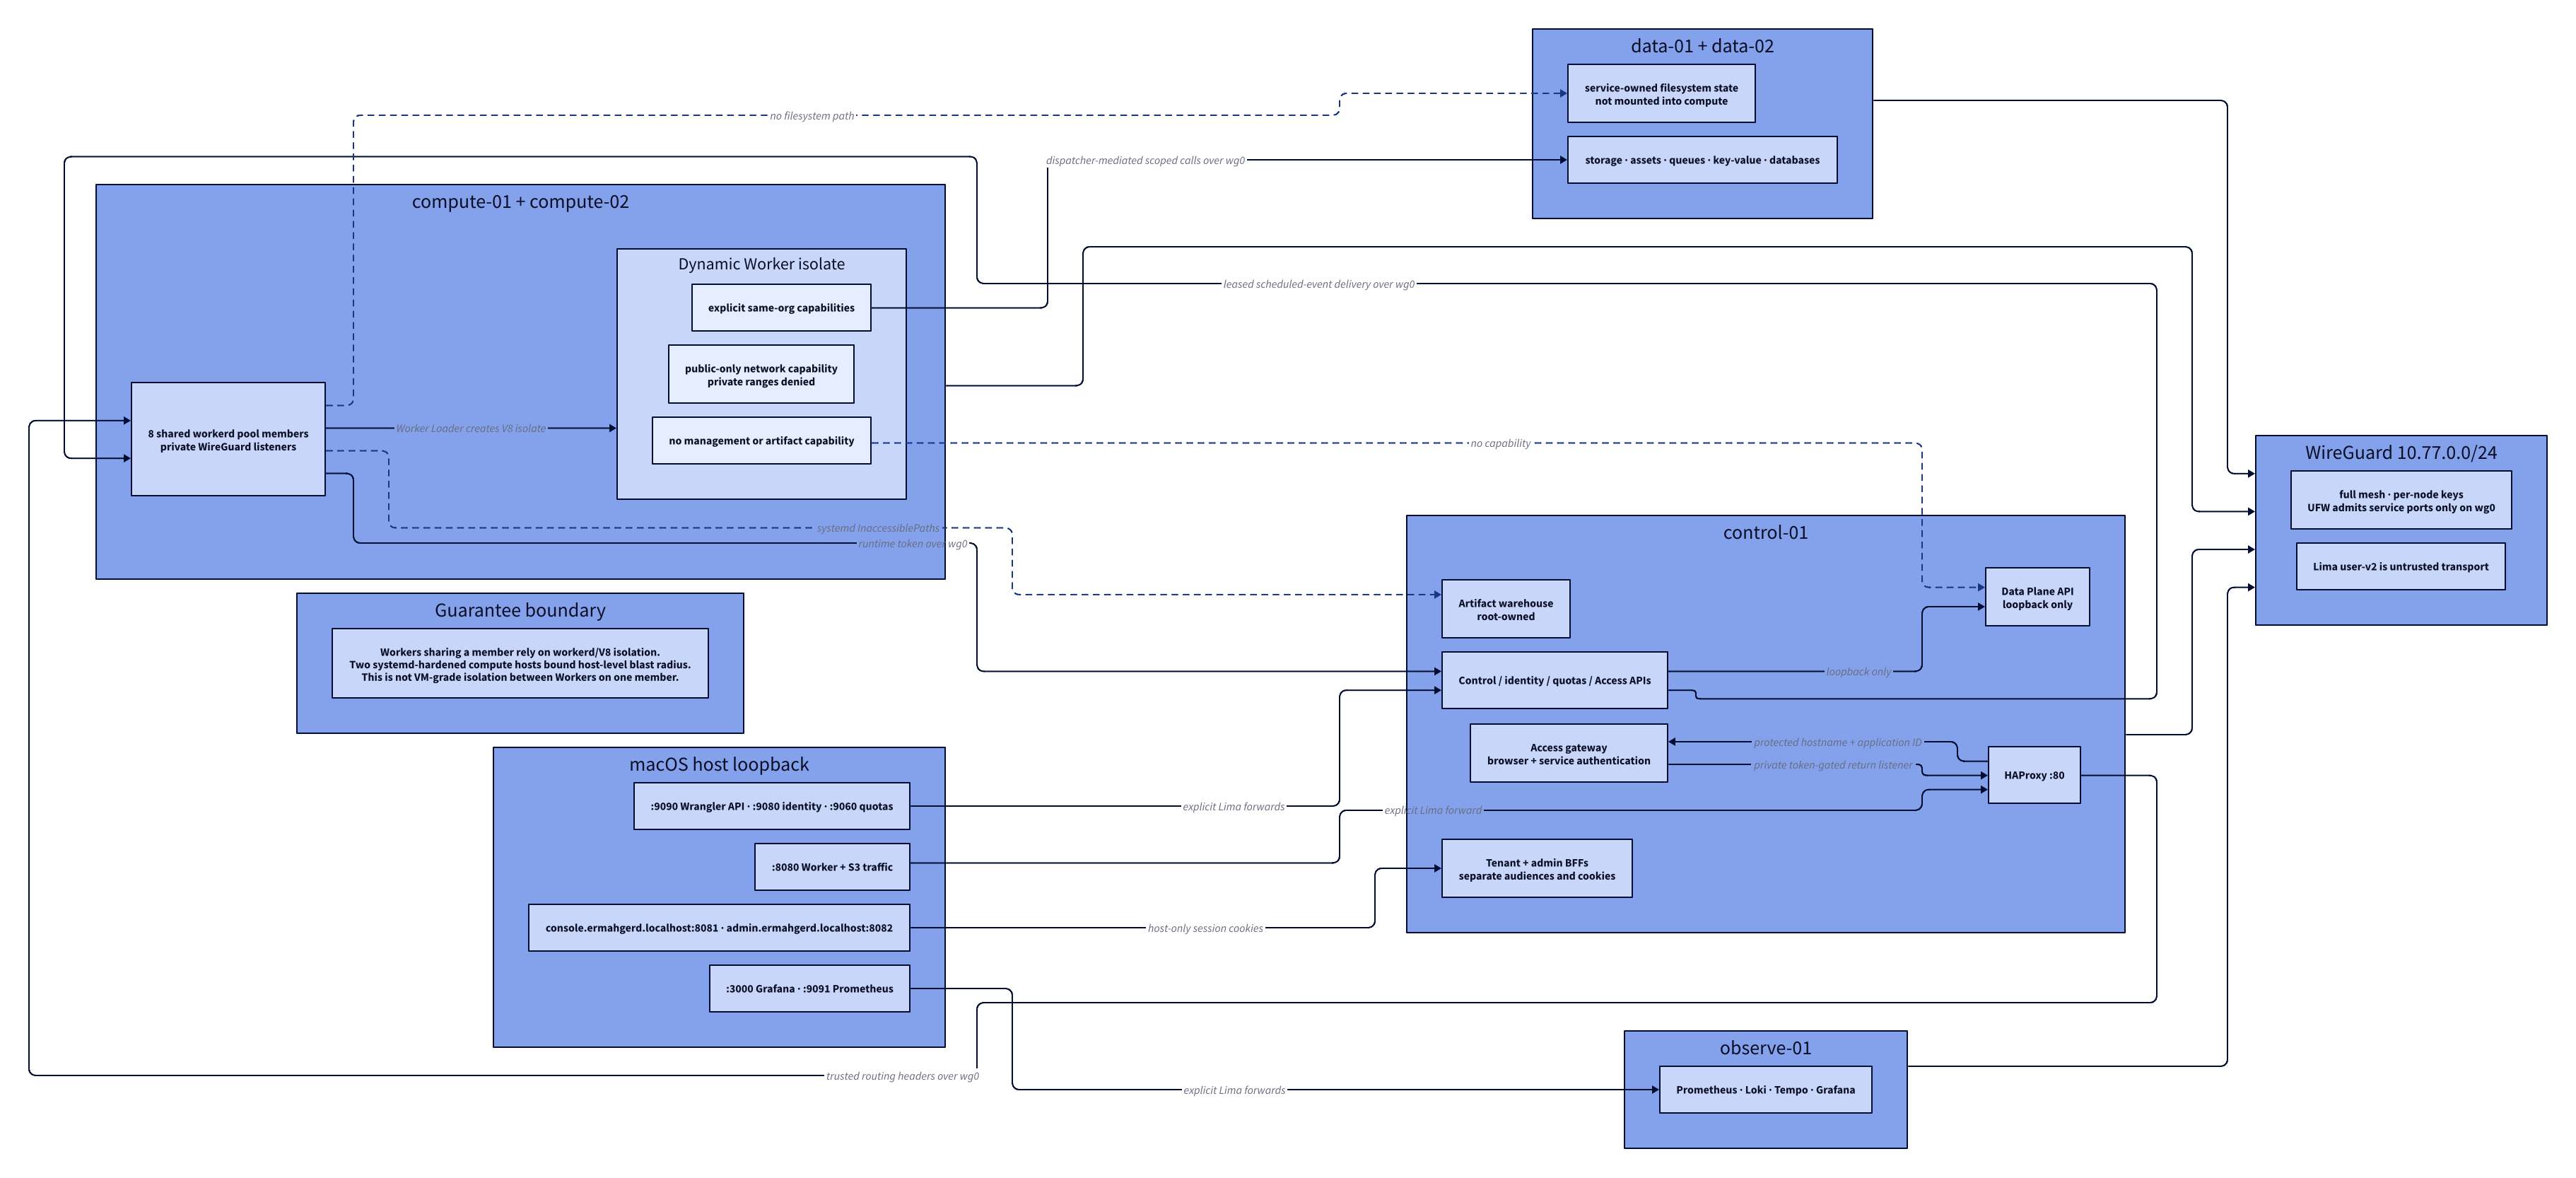
Network topology
This view shows Lima forwards, the private WireGuard mesh, the trusted dispatcher, dynamic Worker capabilities, and the precise V8/process boundary. Tenant and administrator portals use separate localhost hostnames, listeners, service accounts, and host-only browser cookies. Identity enforces their session audiences; the tenant listener does not register platform-administration routes. The administrator identity listener is private and is not forwarded by Lima.
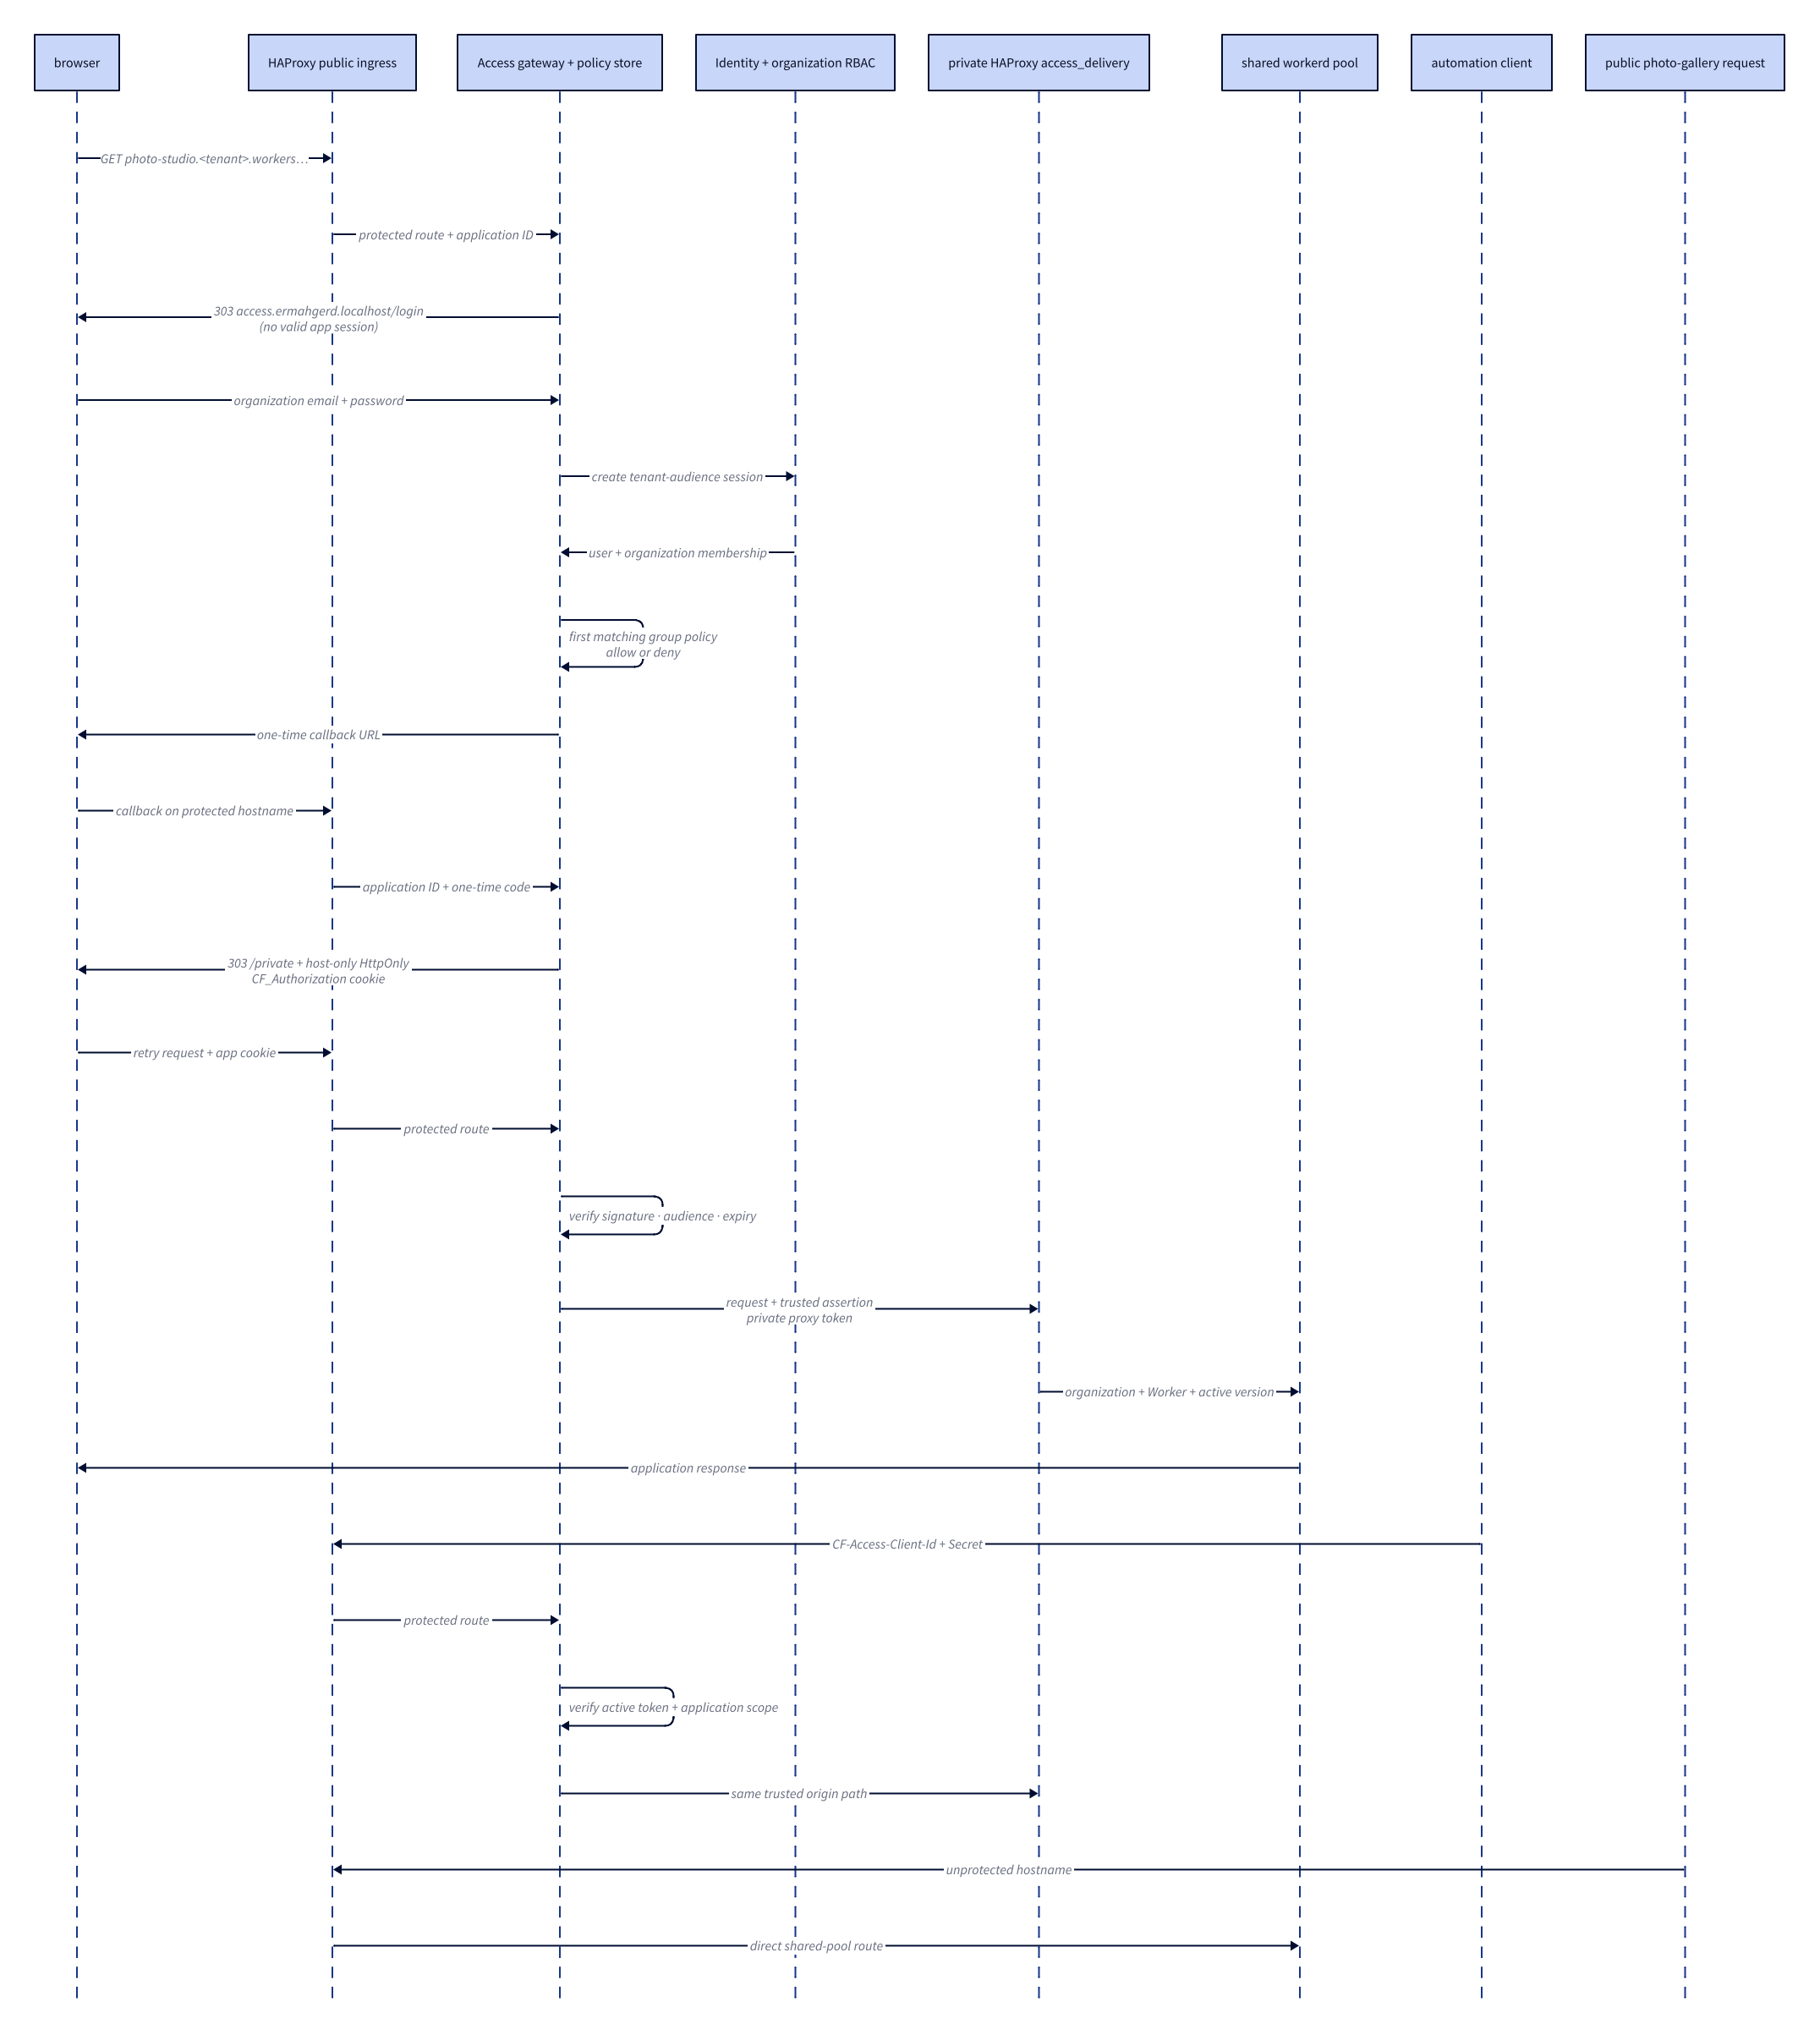
Application Access
This sequence shows how one Worker hostname becomes identity-aware without changing how that Worker is deployed or scheduled. It covers browser login, reusable group policy, the one-time callback, the private return path to the runtime pool, scoped service tokens, and the public-gallery bypass.
Monitoring topology
This view follows metrics, journals, and traces from the host and worker processes through Alloy and Beyla into the local Prometheus, Loki, and Tempo backends queried by Grafana. It also shows the separate k6 data path and native Worker tail collection. The customer console reads tenant-scoped request aggregates and logs through its authorized telemetry API; Grafana remains an advanced operator surface. See Observability for the collection and query boundaries.

Object storage topology
This view shows the two public programming models over one storage engine: SigV4-authenticated S3 clients and bucket-scoped R2-style Worker bindings. It also identifies where organization RBAC, credential resolution, deployment validation, and on-disk ownership are enforced.

Queue delivery topology
This view follows an organization-scoped producer binding into durable broker
state, through alarm-driven native queue() dispatch to the current consumer
version, and finally through retry or dead-letter settlement. It also shows why
Queues have no public hostname and where tenant identity enters every durable
object key.

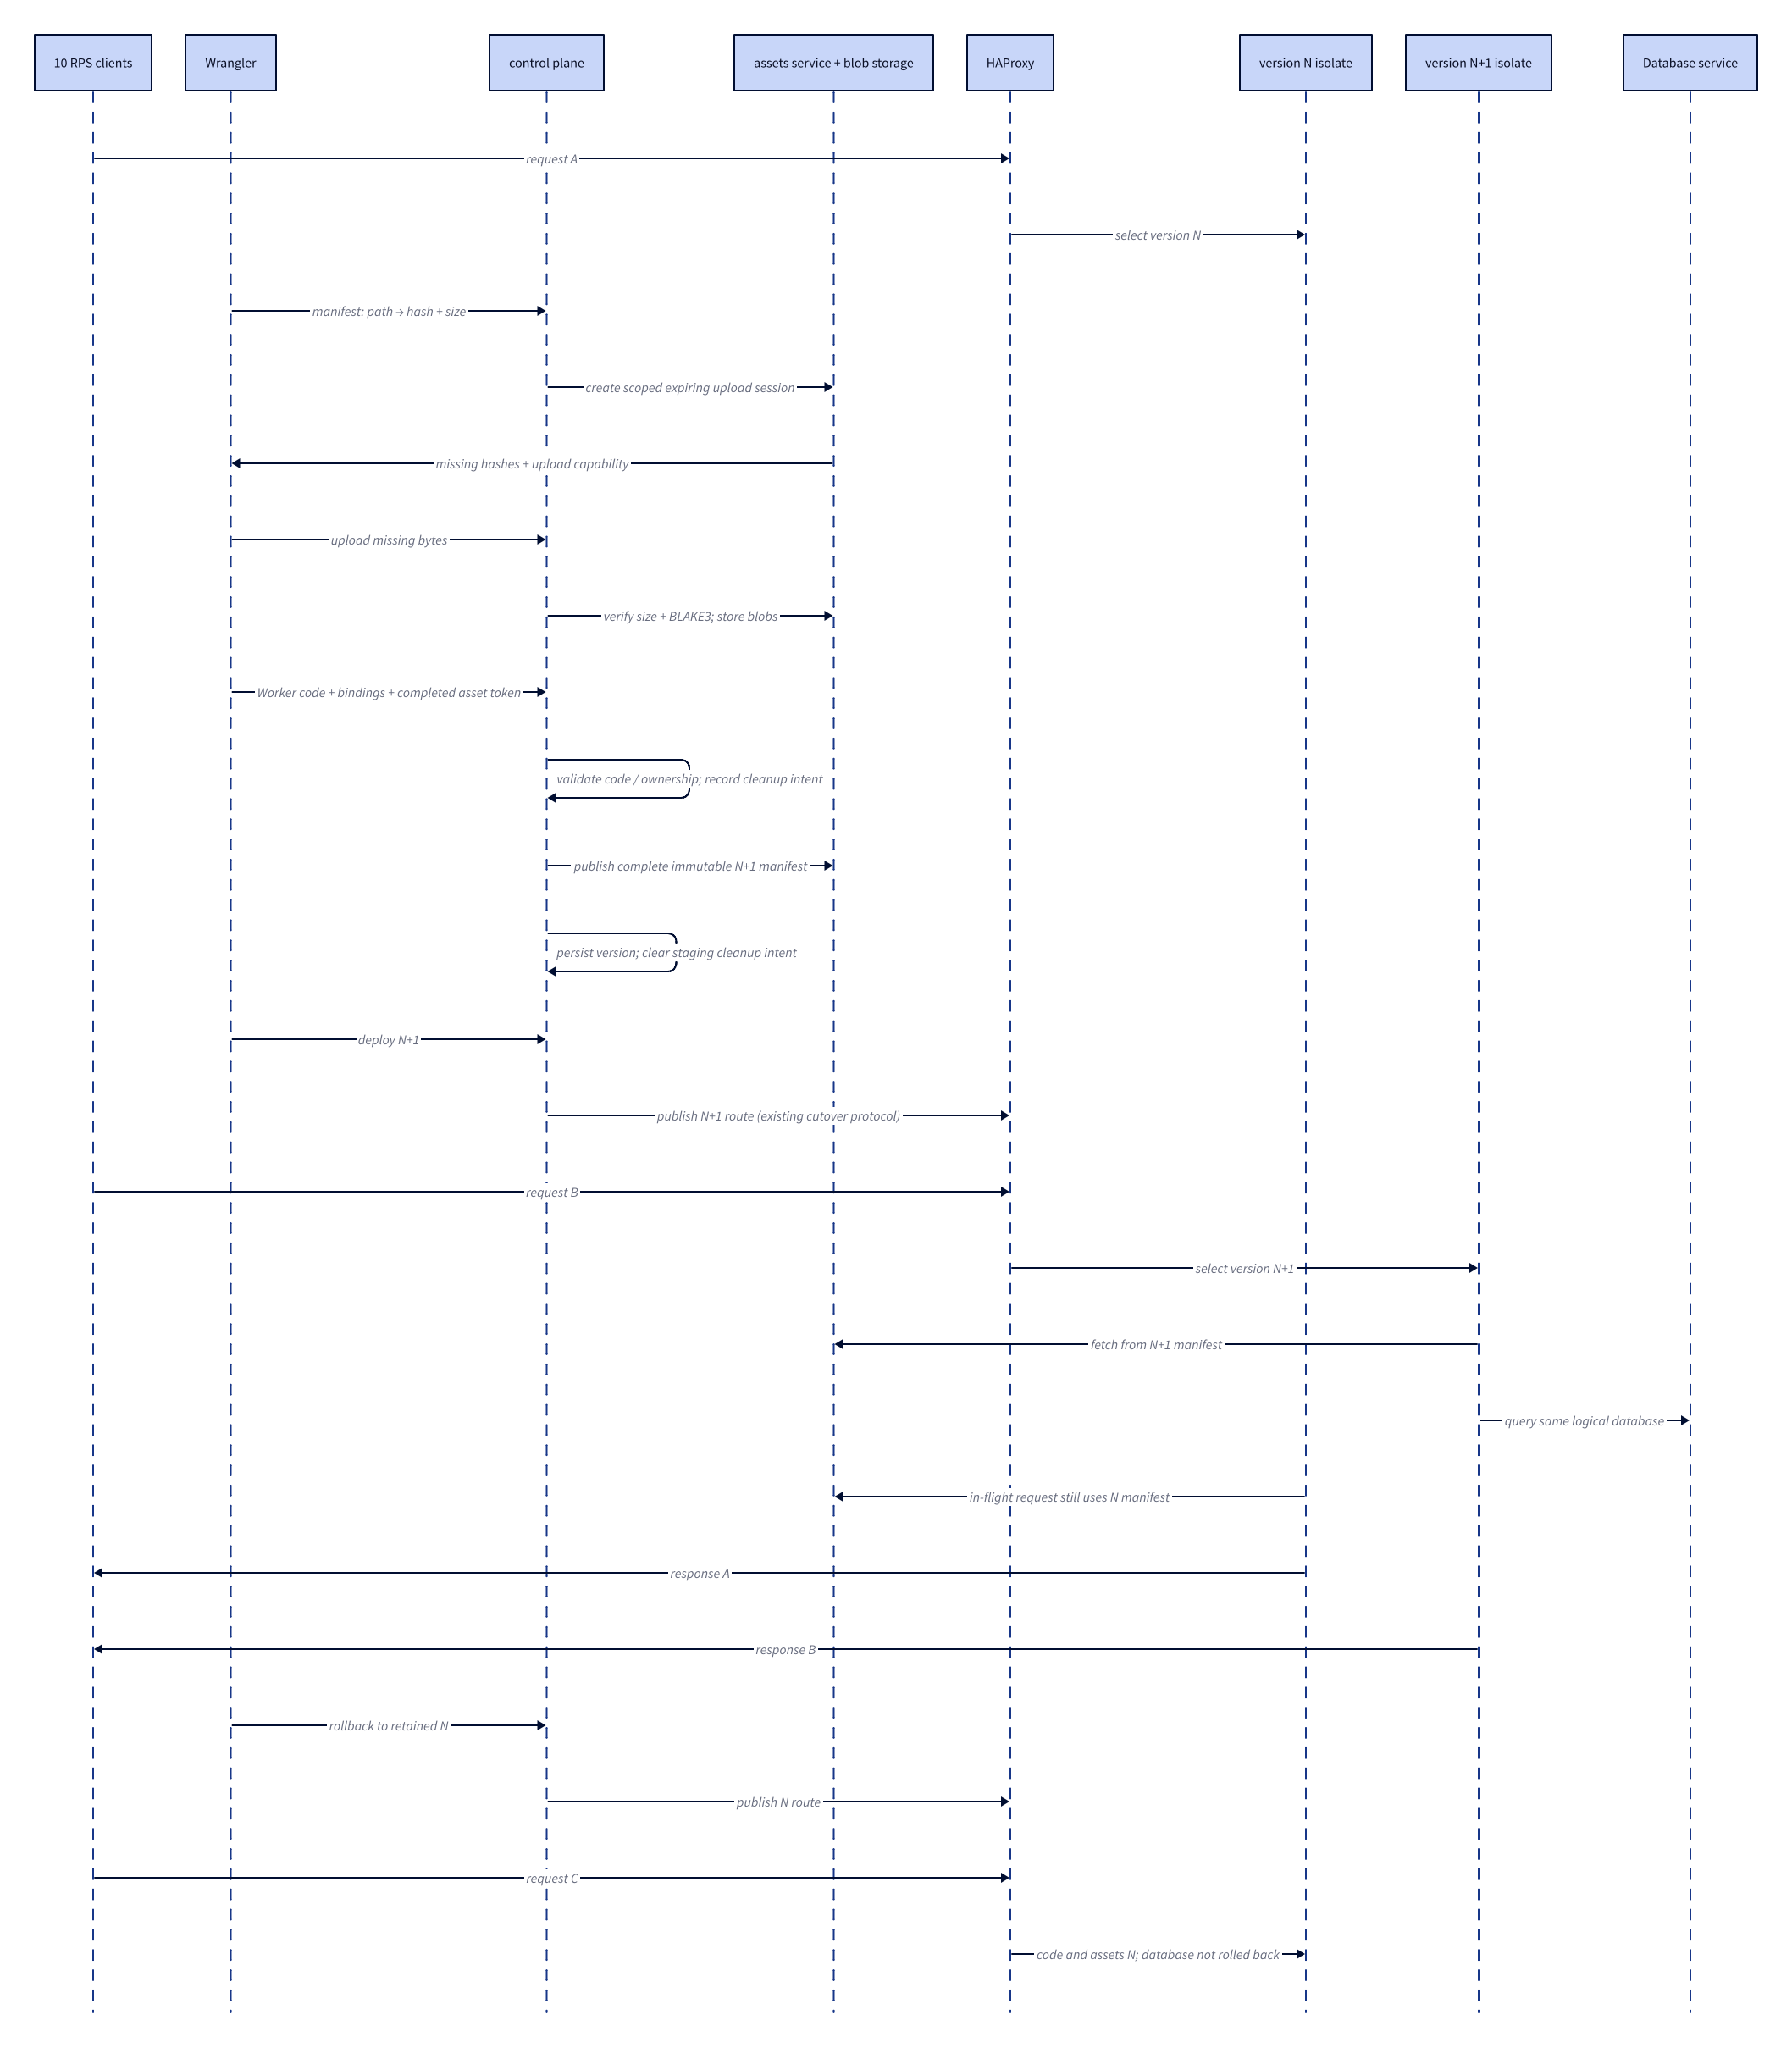
Release sequences
The current sequence is the implementation contract for immutable route cutover under constant traffic. It separates application activation from pool maintenance and makes the first-request dynamic load explicit.
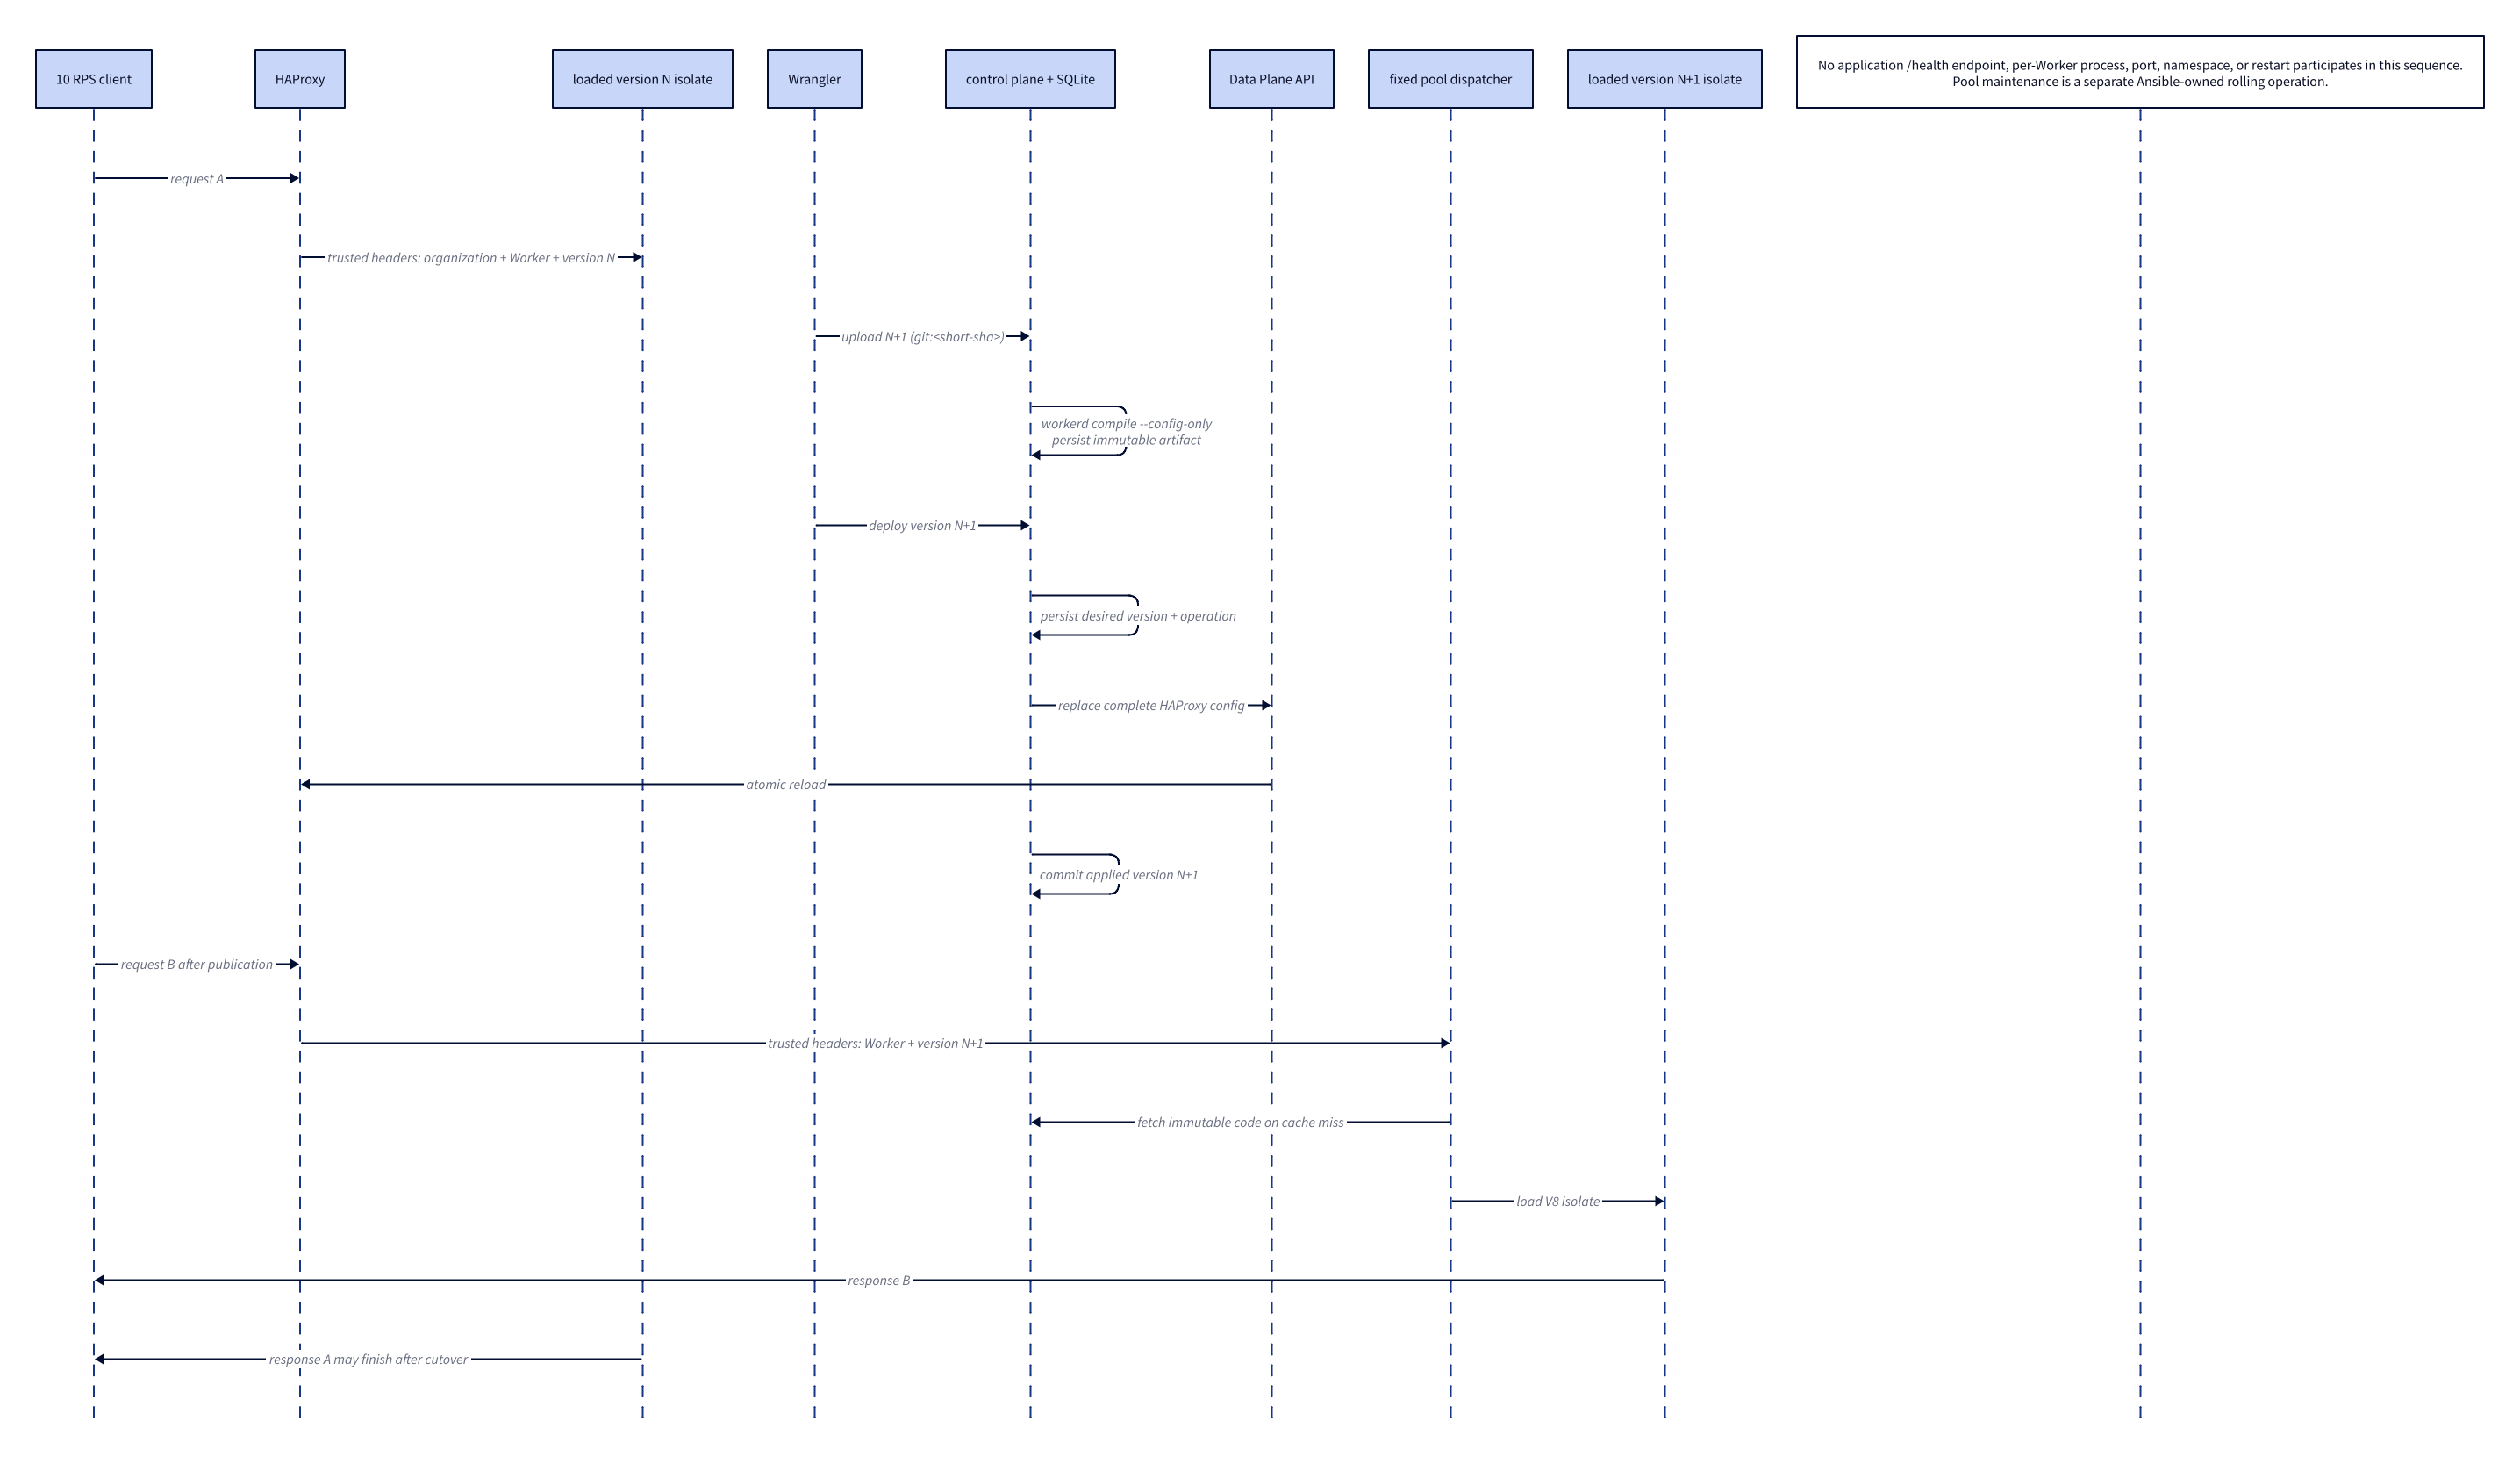
The measured sequence below was generated from rollout
rollout-1791434729415556000: 1,201 requests at 10 RPS across three real
Wrangler deployments, with zero failures or SLO-bad requests, 3 ms p95, 4 ms
p99, and 8 ms maximum end-to-end latency. Route publication took 52.9–57.6 ms.
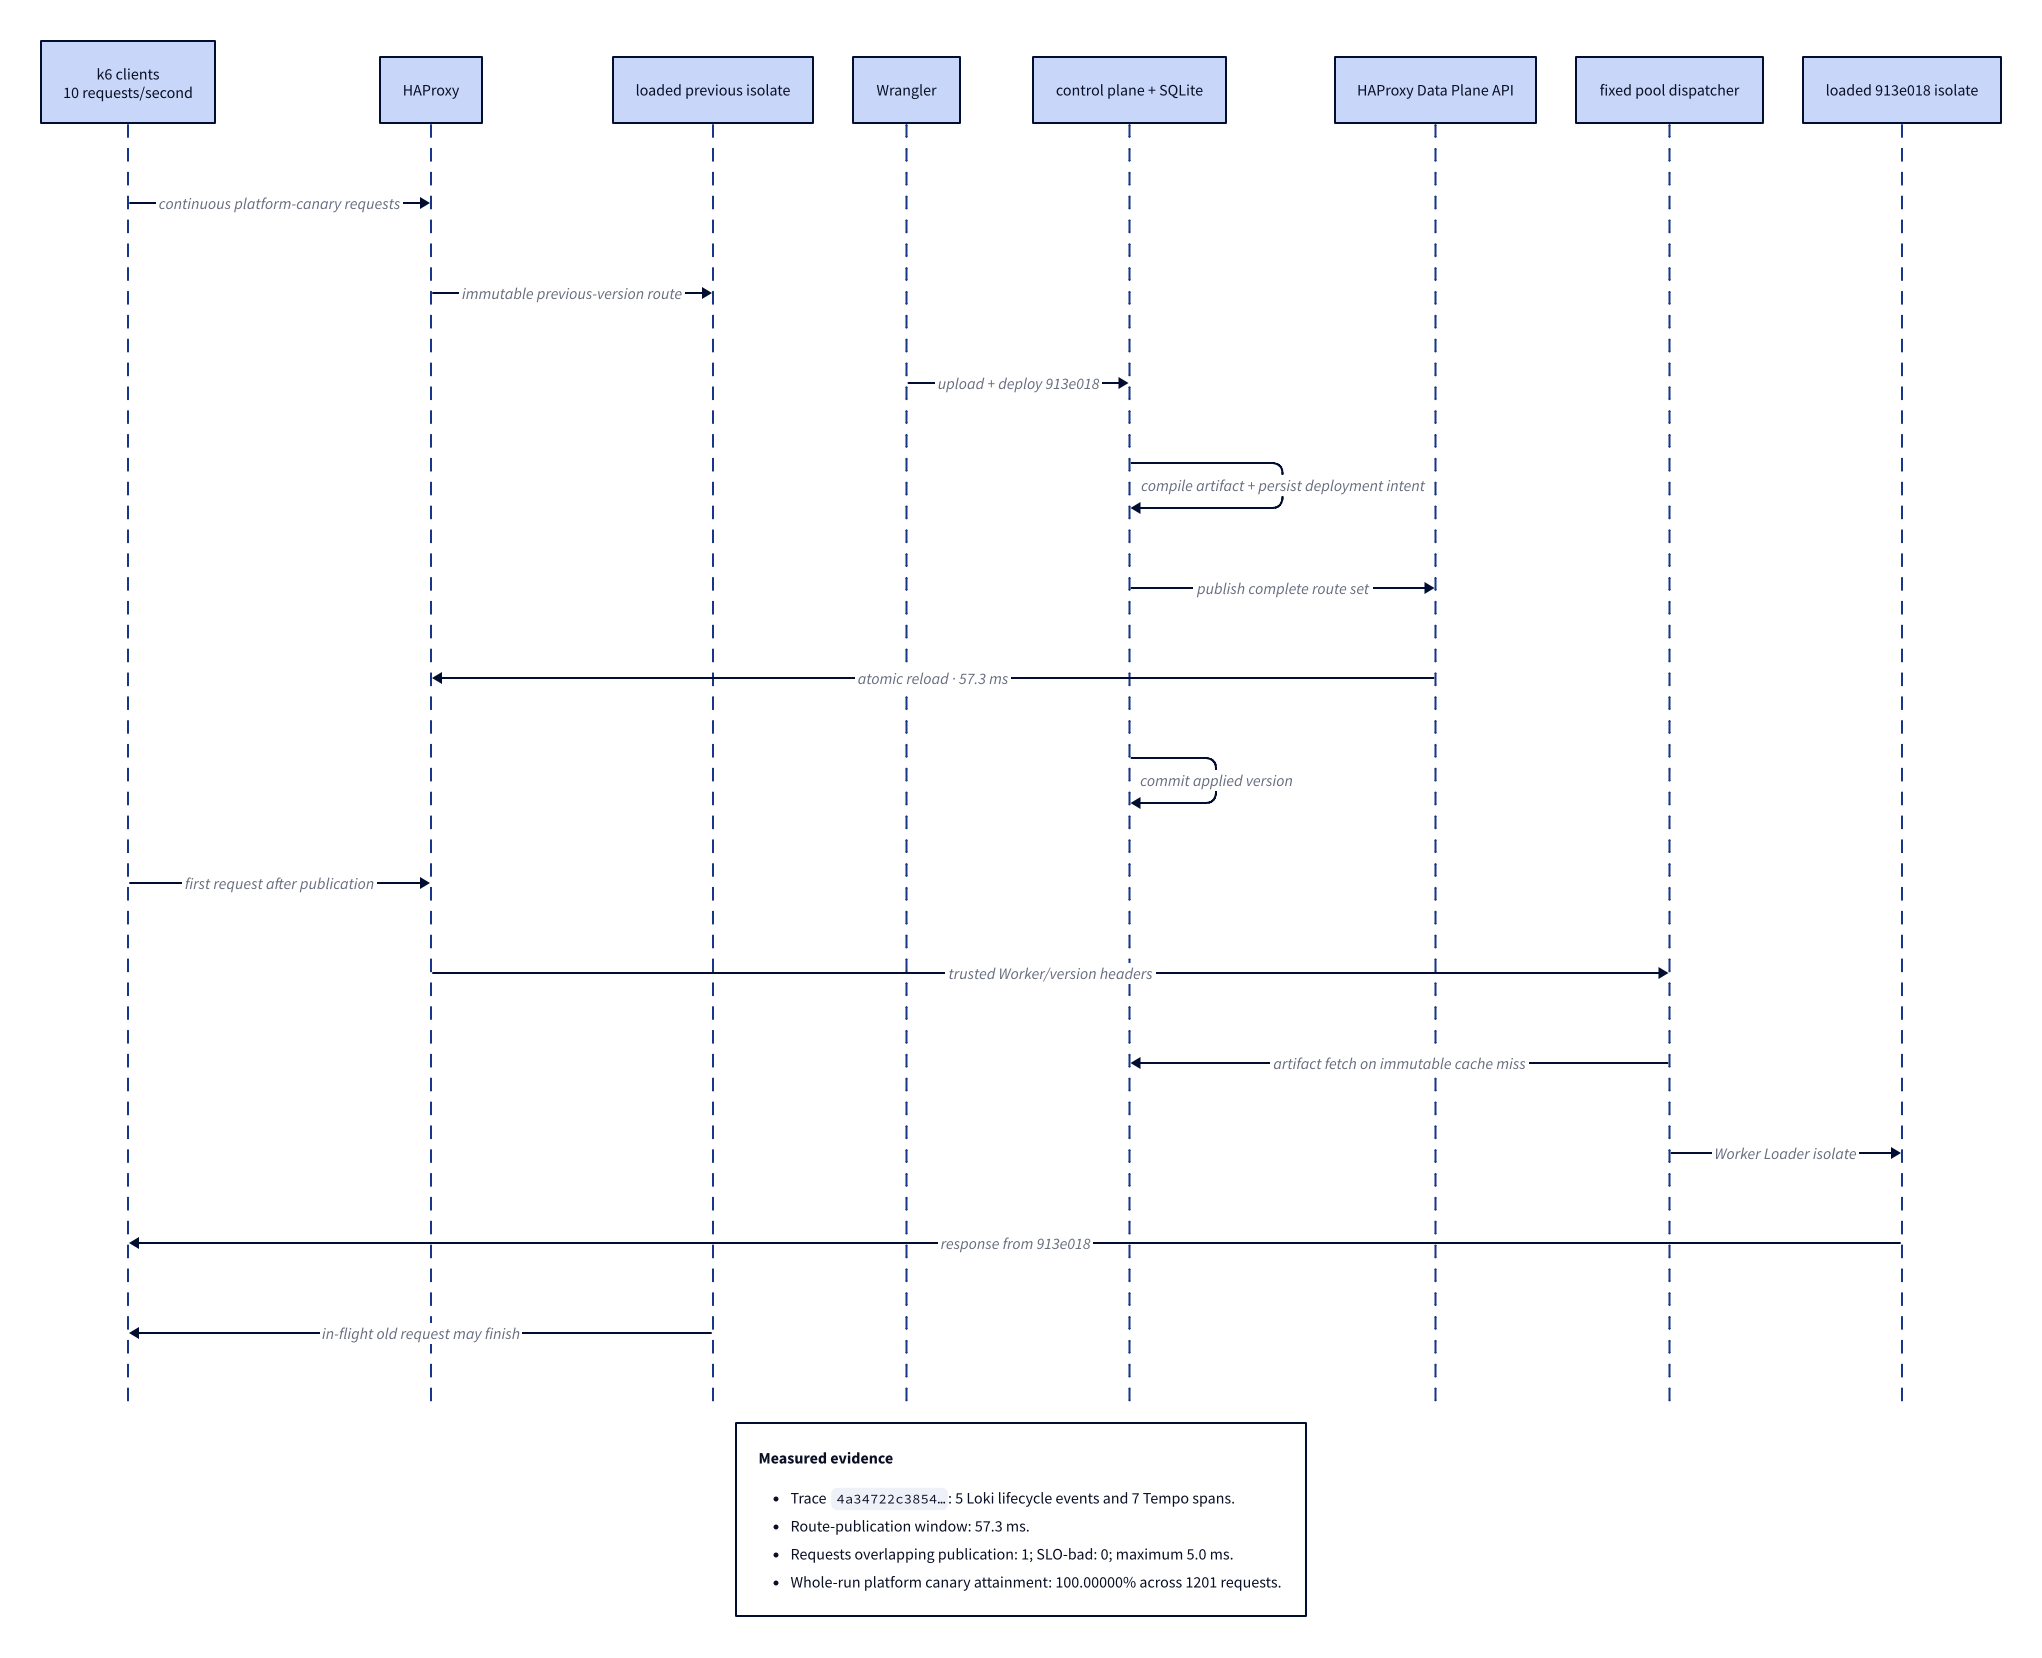
The shared runtime pool is the deployed architecture. It avoids a dedicated process, port, or systemd unit for every Worker while keeping Worker version selection at the route boundary.
make load-update now saves telemetry.json beside each rollout report when
the telemetry backends can be queried. It contains the Loki lifecycle records,
Tempo traces, and bounded Prometheus query results needed for offline sequence
generation. To refresh the measured diagram from a particular run:
make rollout-sequence \
  ROLLOUT_ARTIFACT=.cache/performance/rollout-<id>
If an older artifact has no telemetry.json, first verify the matching guest
is still running and capture it explicitly:
make rollout-evidence \
  ROLLOUT_ARTIFACT=.cache/performance/rollout-<id>
The evidence collector refuses to run unless Lima reports the guest as running. Sequence generation itself is offline and requires only the saved artifact. The generator understands the platform’s lifecycle-event vocabulary; trace data supplies actual nesting and timing, but does not attempt to infer deployment semantics from arbitrary spans.
Rendering
Install D2 and render all diagrams with:
make diagramsThe Make target uses the bundled ELK layout engine, a fixed theme, scale, and
padding so rerenders are consistent. Run d2 fmt docs/architecture/*.d2 when
making larger source changes.