The console is the primary day-to-day view of an organization. It keeps organization resources, deployment history, quotas, and operational signals in one place while Wrangler remains the deployment interface.
Open http://console.ermahgerd.localhost:8081 for tenant resources, or
http://admin.ermahgerd.localhost:8082 for platform administration. The local bootstrap
account (owner@localhost / local-owner-password) can sign in to both.
The portals have independent sessions: signing out of one leaves the other
signed in. Organization owners are not automatically platform administrators.
The minimal public landing page is http://ermahgerd.localhost:8080.
Choose an organization
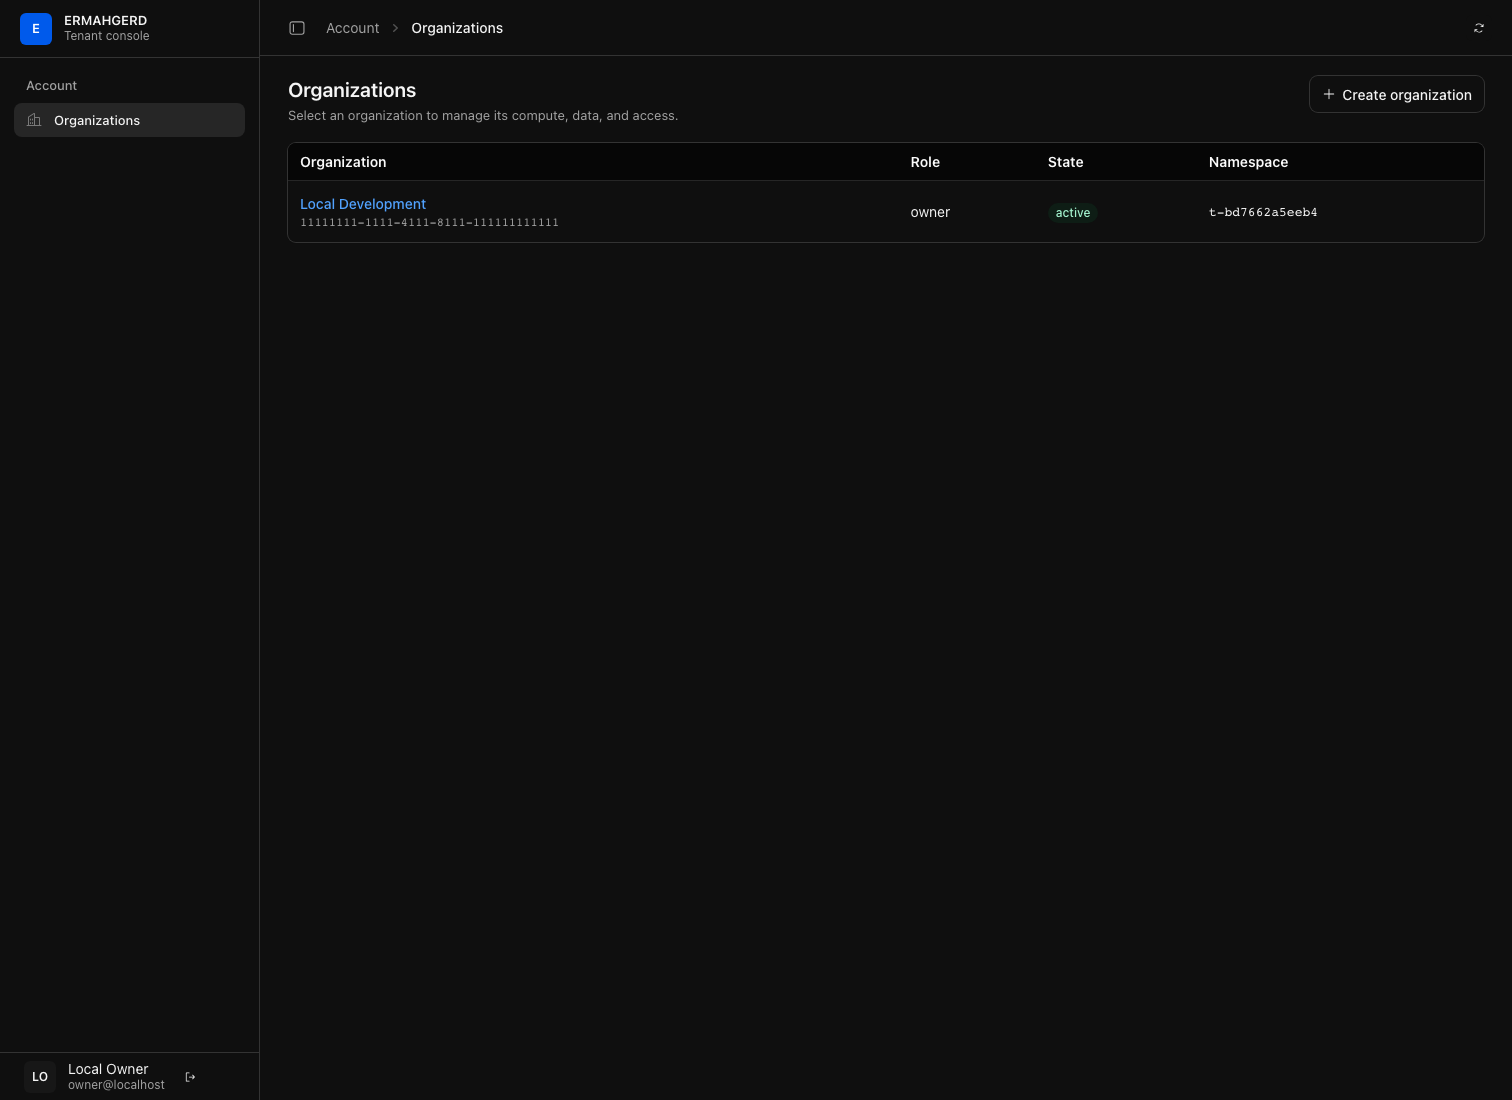
After signing in, the organization directory is the account-level home. A customer-invited account can create an organization there; an account created through a team invitation can only enter organizations it has joined. Select an organization’s linked name to enter its resource views. Until an organization is selected, the sidebar contains only account-level navigation.
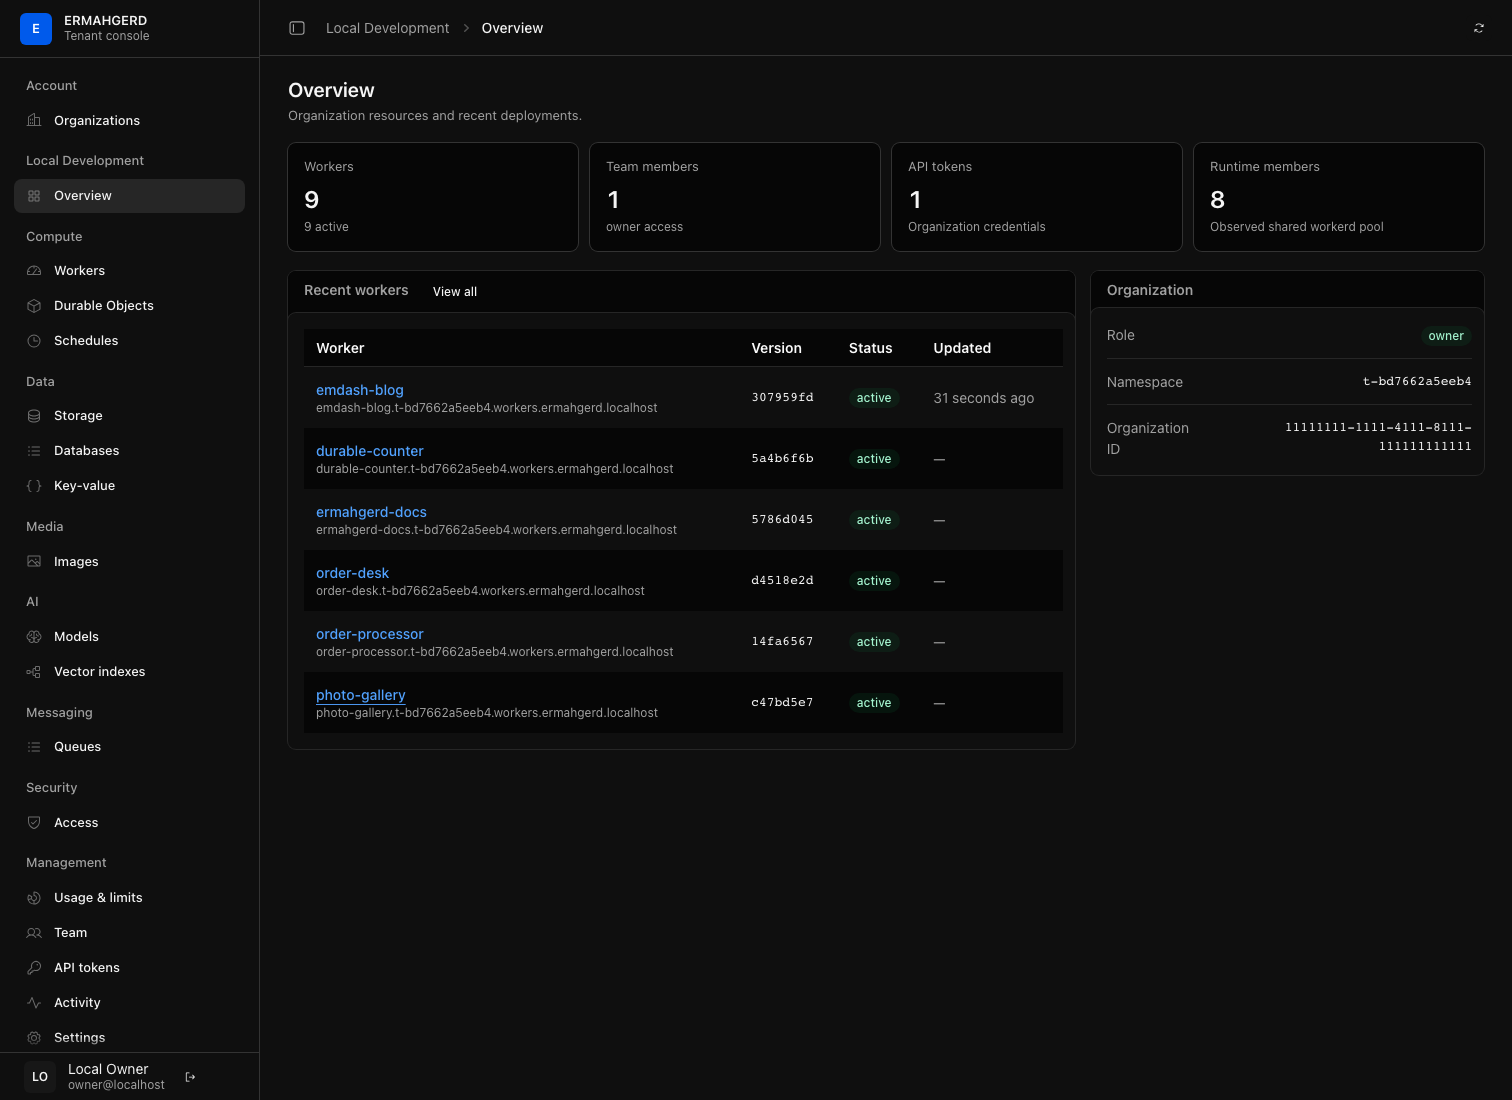
Inside an organization, the overview gives a compact inventory of Workers, members, credentials, runtime capacity, and recent deployments. Use the sidebar to move between the organization’s resources; its URL always identifies the current organization and view, so pages can be refreshed, bookmarked, and shared.
Resource tables show 25 rows by default and offer 10, 25, 50, 100, and 150-row page sizes when needed. Page number and page size remain in the URL alongside the view’s other filters, so reloading or sharing a long inventory returns to the same place.
The navigation follows the platform model: Compute, Data, Media, AI,
Messaging, Security, and Management group related tenant resources.
AI contains provider connections and vector indexes; it is where an
organization brings its own provider account before a Worker uses env.AI.
Security →
Access manages protected Worker hostnames, reusable groups, application
policies, scoped service credentials, and access events. The separate
administrator portal contains only the Platform navigation: overview,
organizations, customers, fleet, and events and logs. Administrators do not need a tenant
membership to use it.
Inspect a Worker before or after a deployment
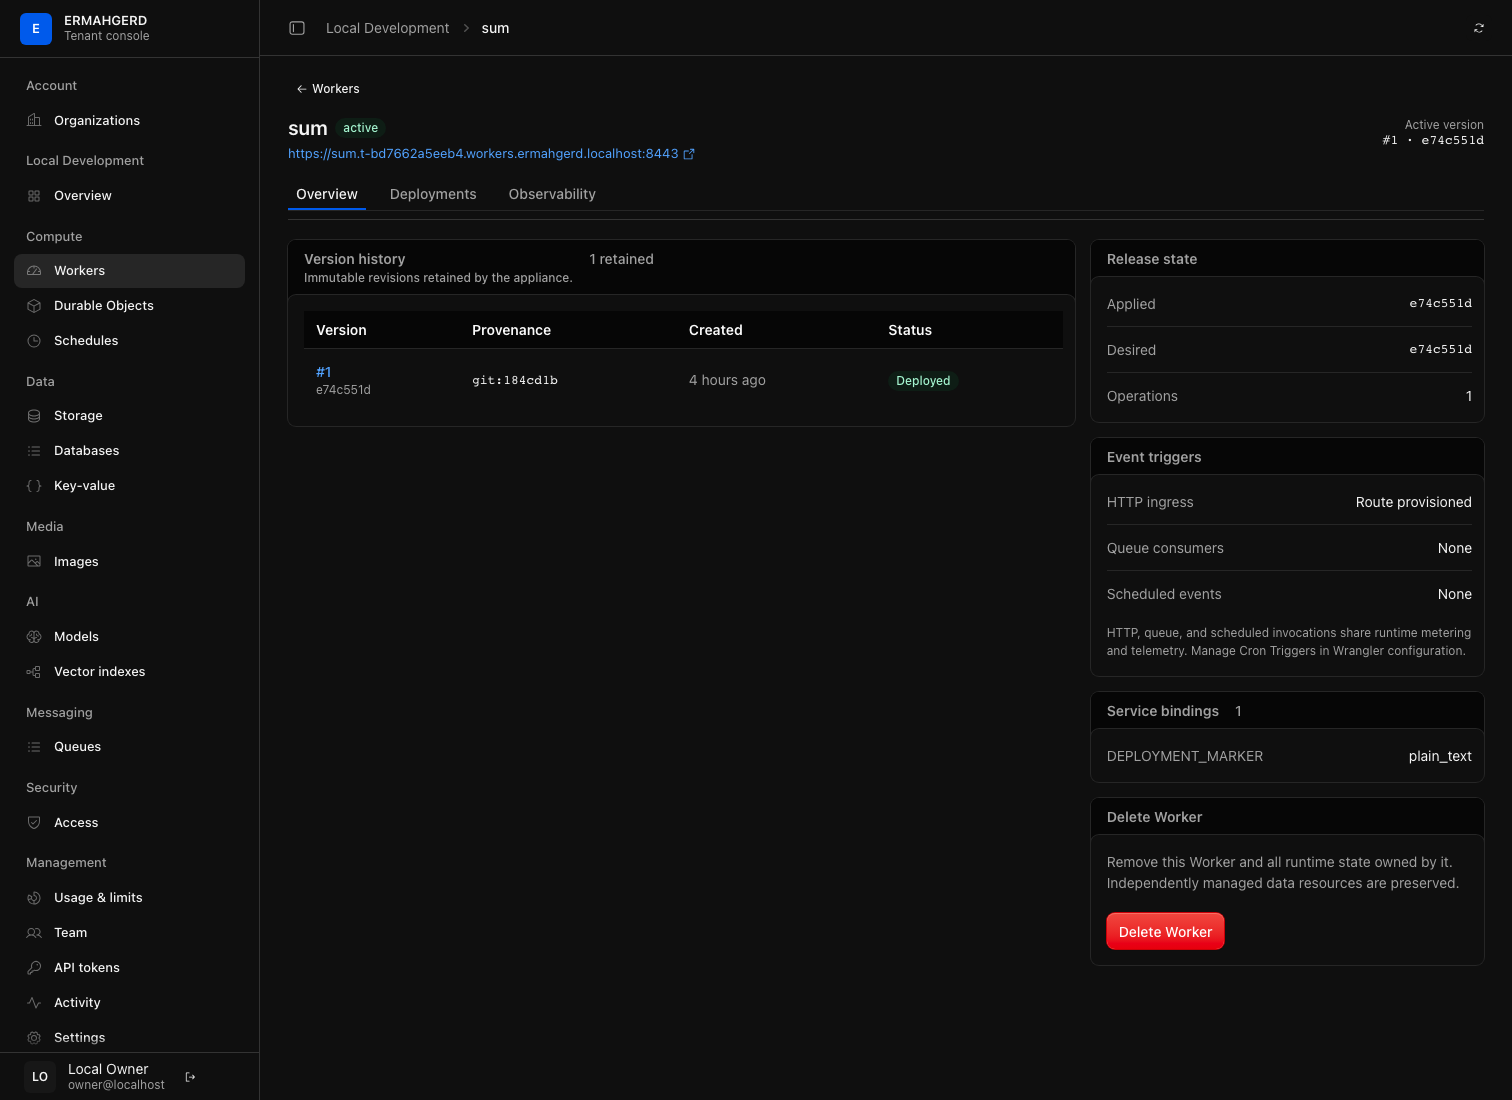
Select a Worker to see its active version and revision history. Use the Deployments tab for one revision’s deployment metadata and the Observability tab for traffic, latency, and recent application events. The console does not deploy source code: deploy with Wrangler, then use this view to inspect the result or roll back to a prior revision.
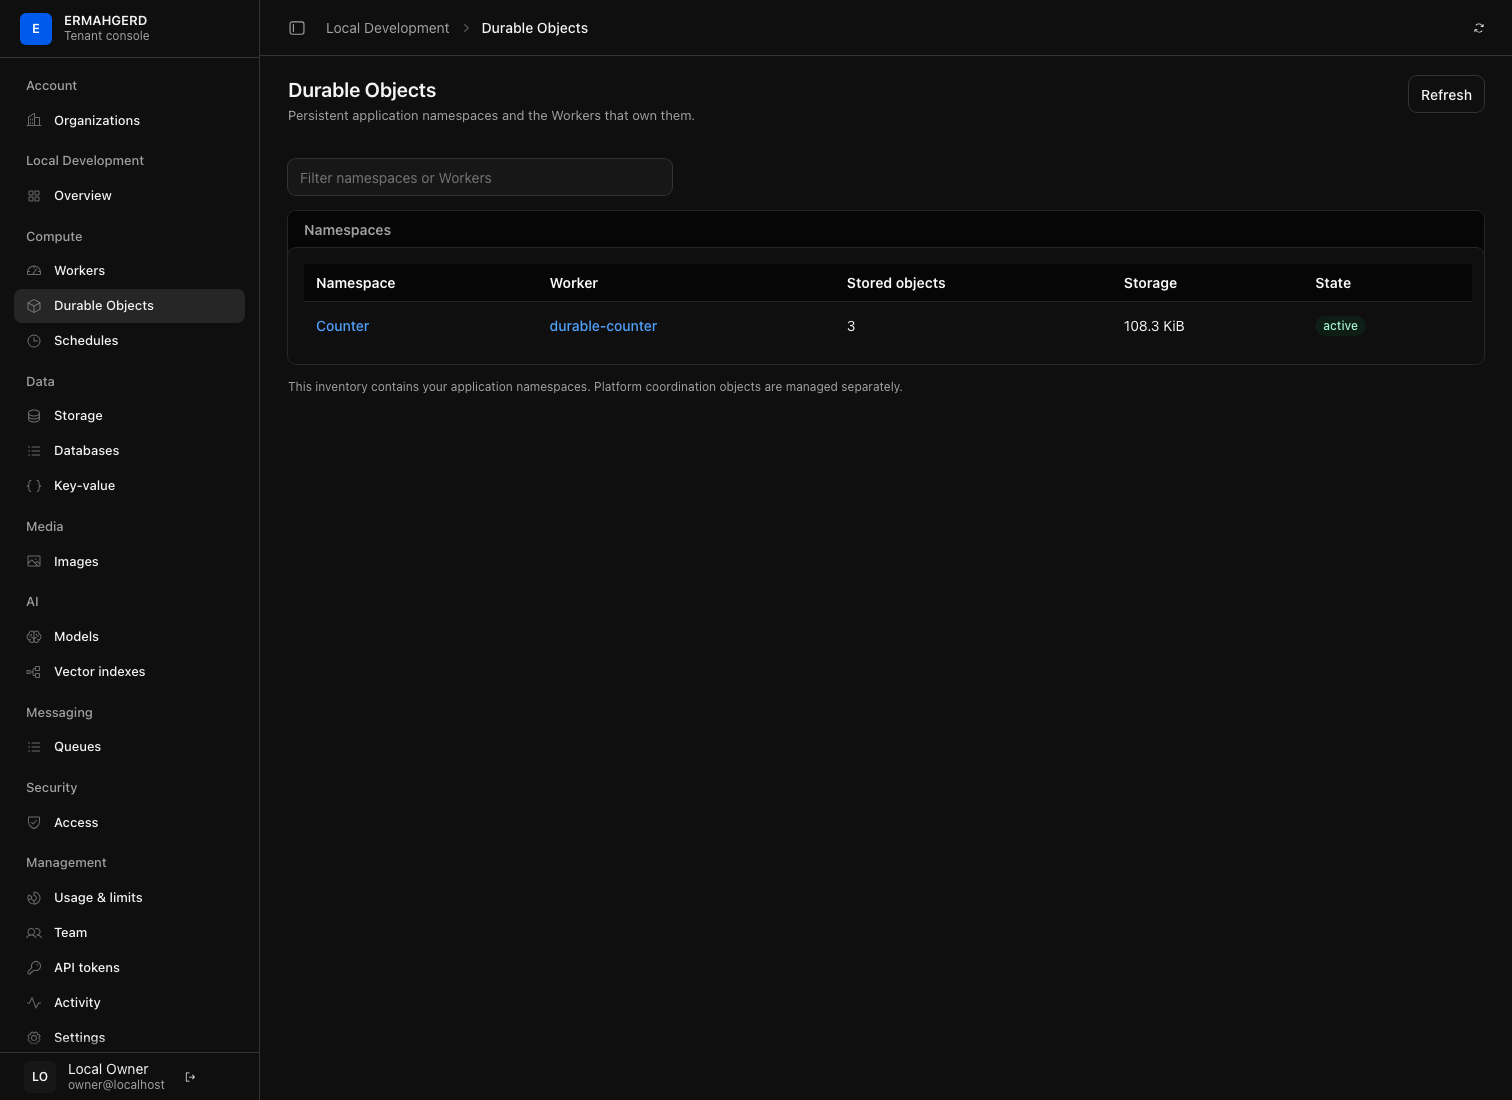
Workers with native Durable Object bindings also expose a Durable Objects tab. It shows the stable shared-pool placement, Wrangler migration tag, namespace identities, observed native storage, and bounded lifecycle history. For the organization-wide view, open Compute → Durable Objects. Namespace names link to a focused detail with storage, ownership, migration, and lifecycle pages. Stored object counts describe persisted databases, not running instances.
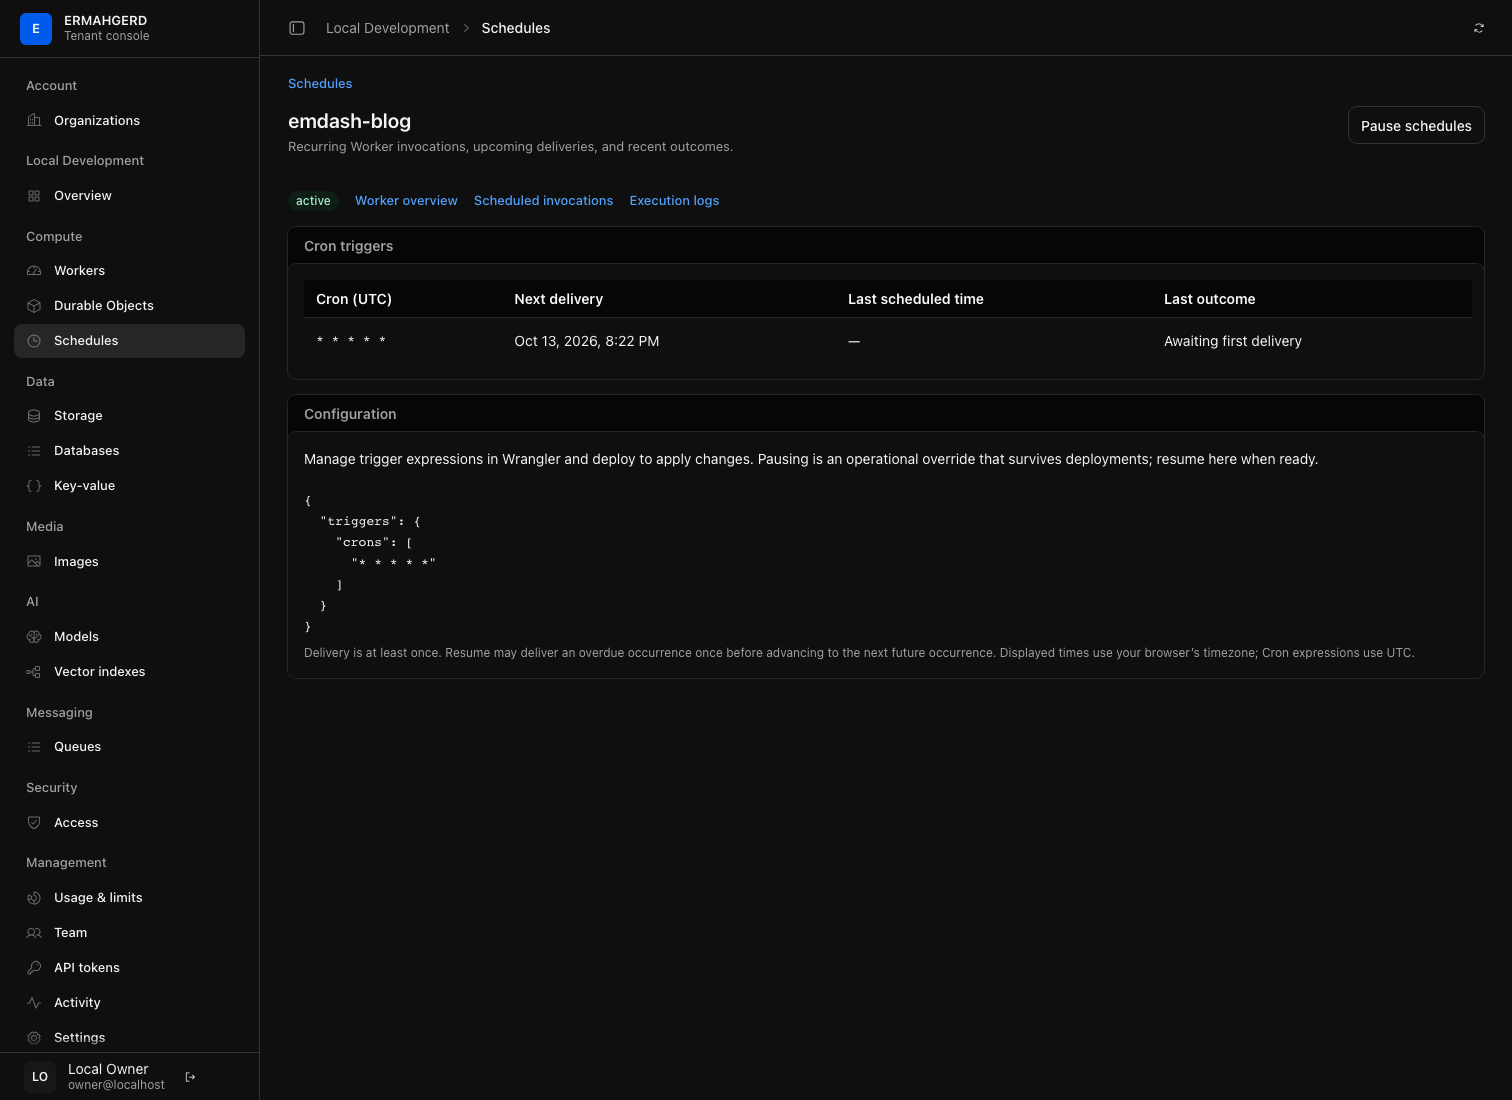
The Worker overview also lists its event triggers. HTTP ingress and configured queue consumers are explicit, and background activity is visible in the Observability tab as invocation rate and outcome. Queue consumers also receive queue-service handler duration percentiles. Shared-pool CPU and memory are shown as capacity context, not fictional per-Worker allocation. Configured Cron Triggers link to Compute → Schedules. This page lists scheduled Workers, next deliveries, and current state. Open a Worker to inspect each Cron expression and its last outcome, pause or resume delivery, or continue into scheduled invocation telemetry and logs. An operational pause survives deployments; expressions are still managed in Wrangler. See Schedules.
Work with data and AI
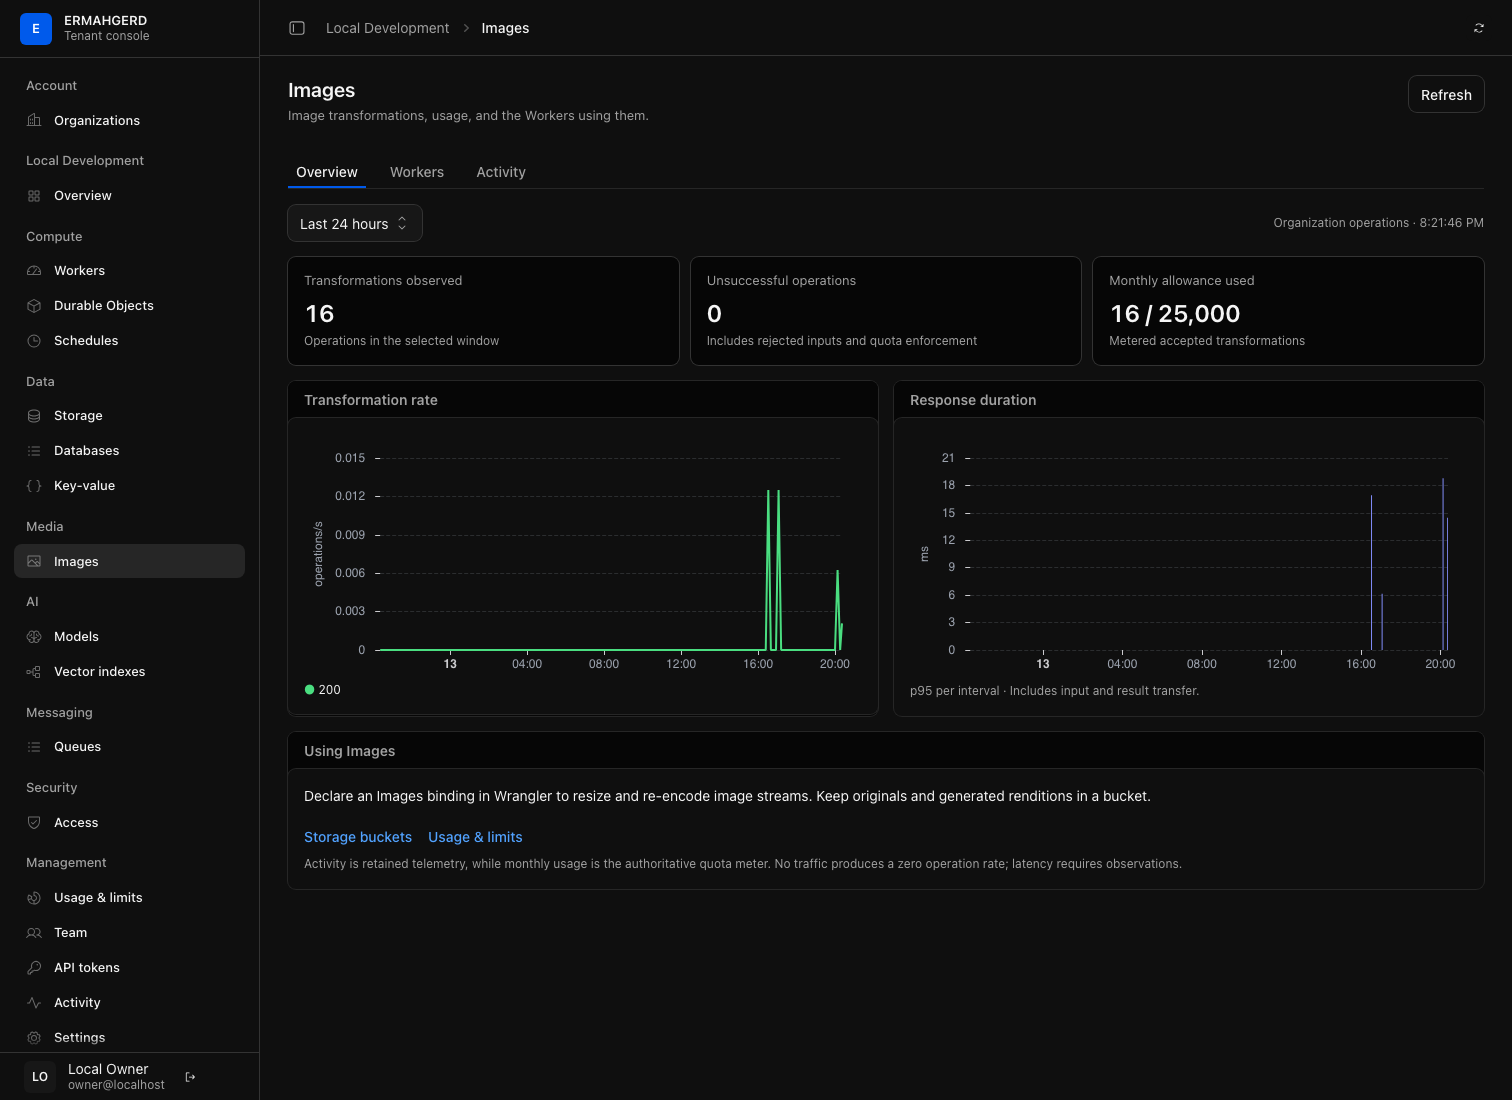
Media → Images separates transformation usage, bound Workers, and recent activity into focused tabs. Time range and table selections stay in the URL. The monthly allowance comes from quota metering; charts and recent operations come from organization-scoped telemetry and can have a shorter retention window. Images does not store photos: browse originals and renditions in Storage.
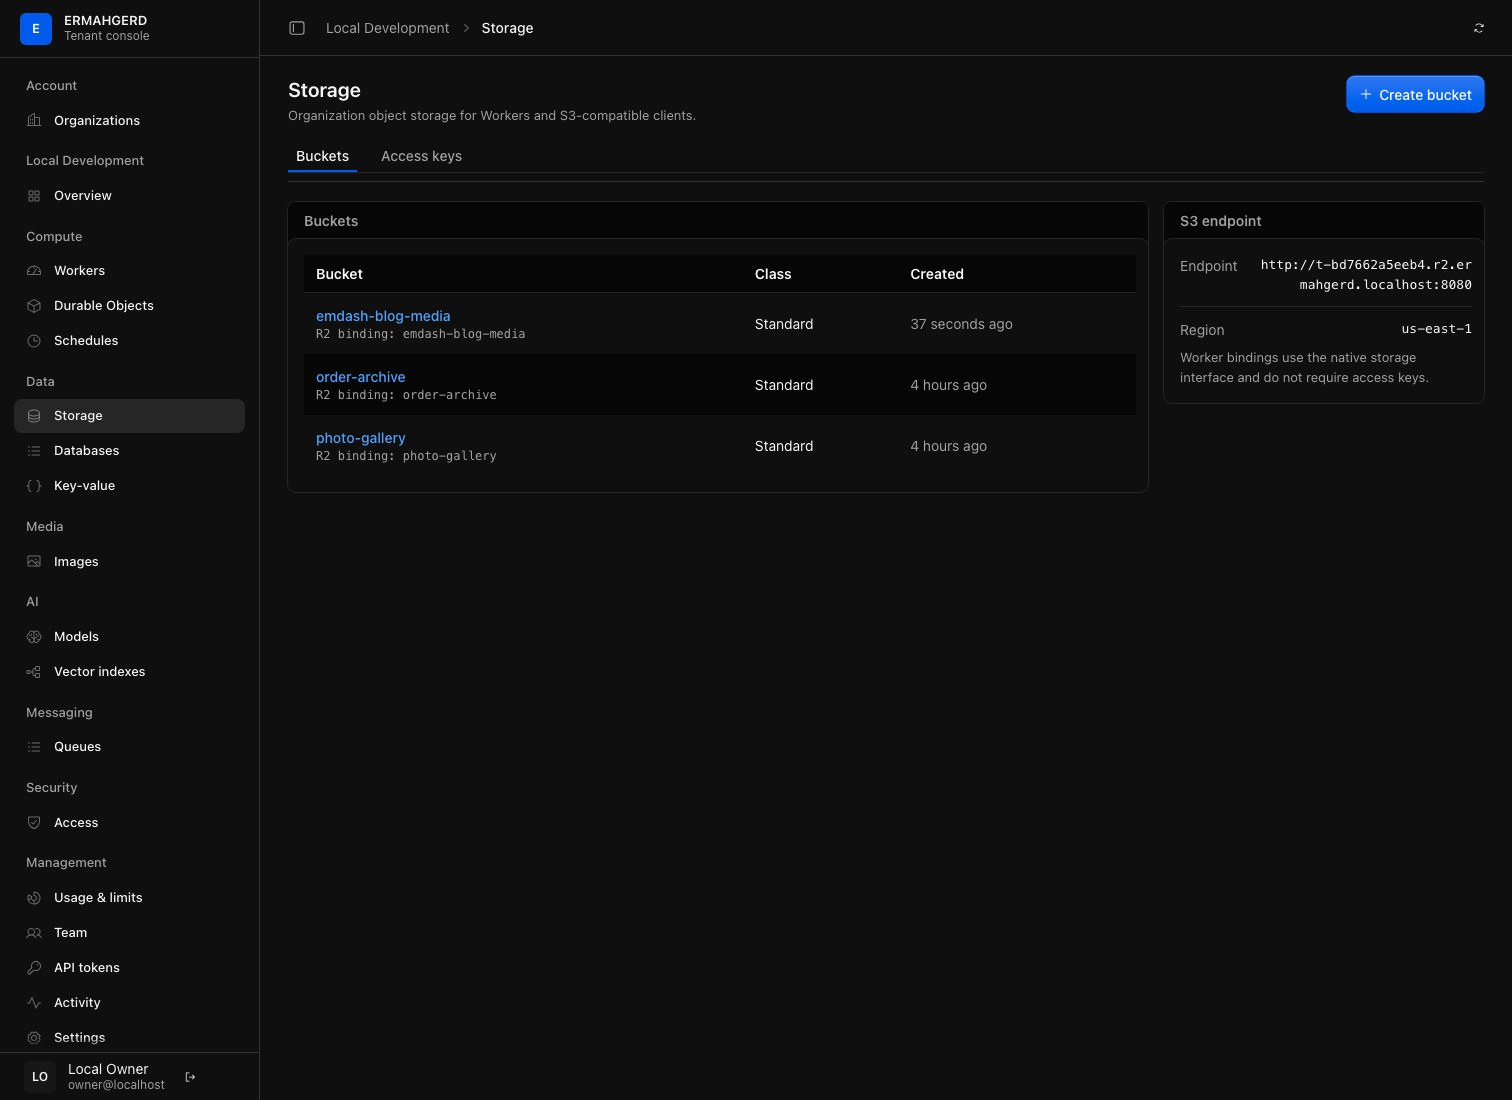
Storage presents buckets as navigable object browsers. Prefixes behave as folders, object details expose metadata and version information, and destructive operations require explicit confirmation. The same bucket can be used by an S3-compatible client or bound to a Worker as R2-style storage.
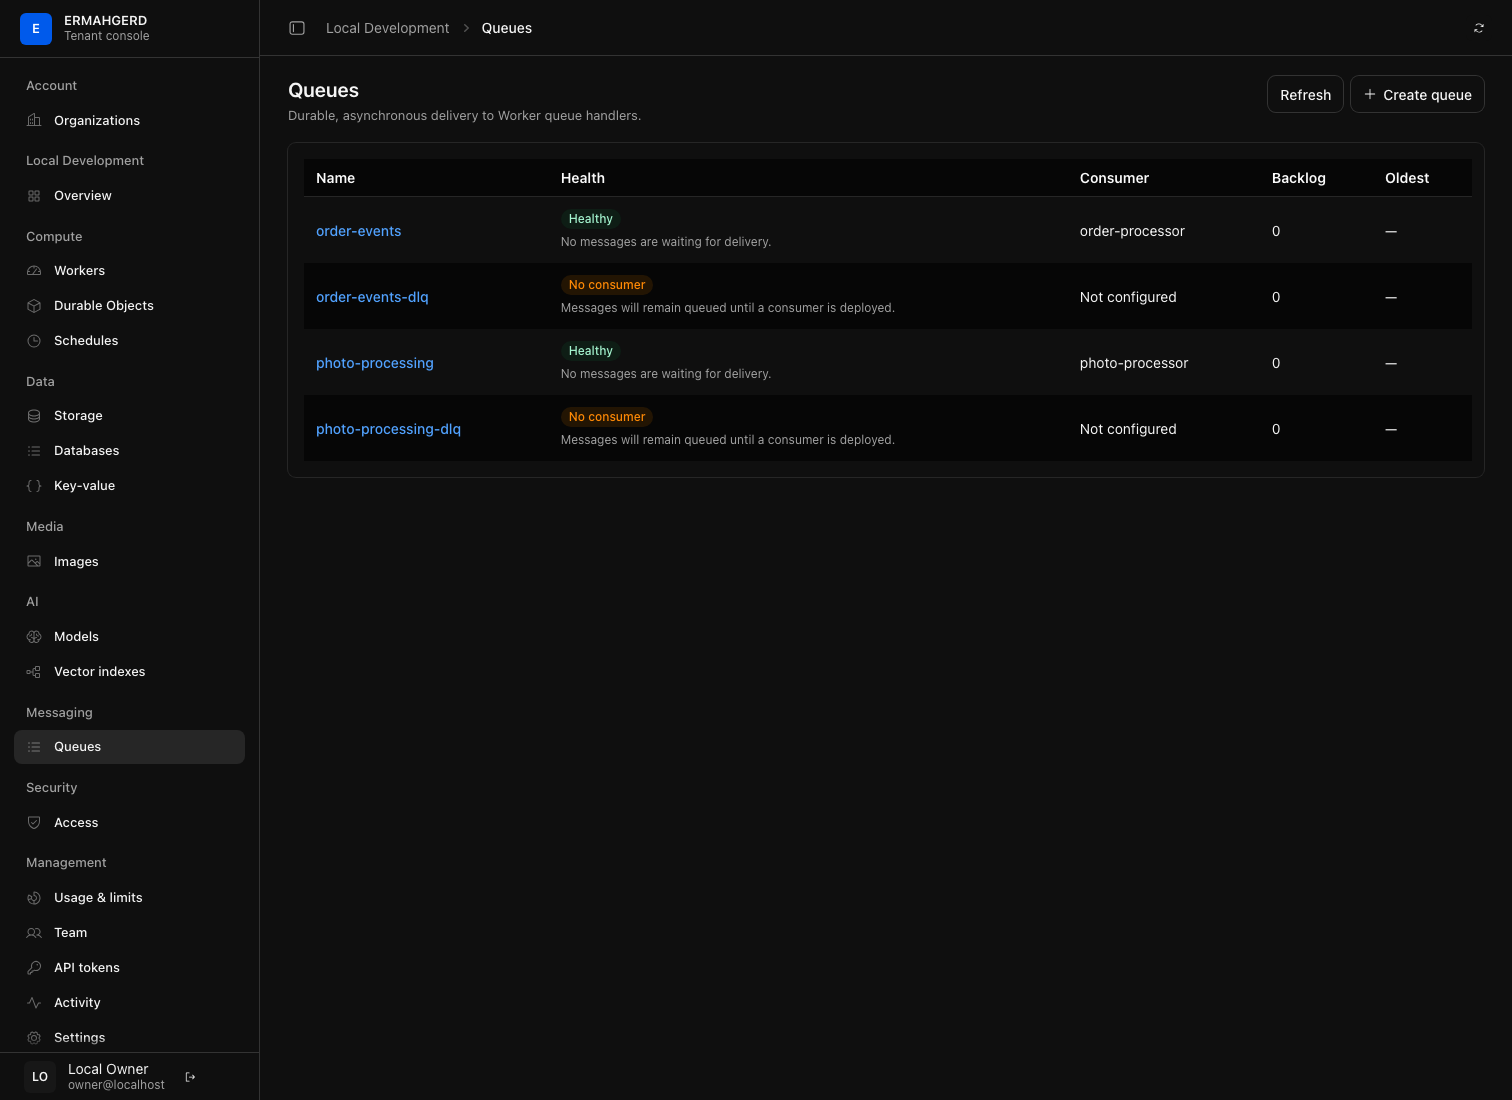
Queues makes delivery state visible to the organization that owns it. The detail view combines backlog and activity with consumer settings, pending messages, and durable delivery events. Pausing live updates freezes the view while investigating without changing queue processing.
Key-value provides tenant-scoped namespaces for small configuration and coordination values. The namespace page supports prefix browsing, UTF-8 value and JSON metadata inspection, expiration, activity history, and deliberate rename or deletion. Values remain subject to the service’s 64 KiB limit; use Storage for objects and large payloads.
AI → Models stores a connection to an organization-owned OpenAI, Anthropic,
or Fireworks account. The console never reveals a saved provider credential.
Workers use the native AI binding instead. Vector indexes creates and
inspects the indexes those Workers can bind through Wrangler. See AI and vector
search for the binding and supported provider calls.
Review limits and appliance health
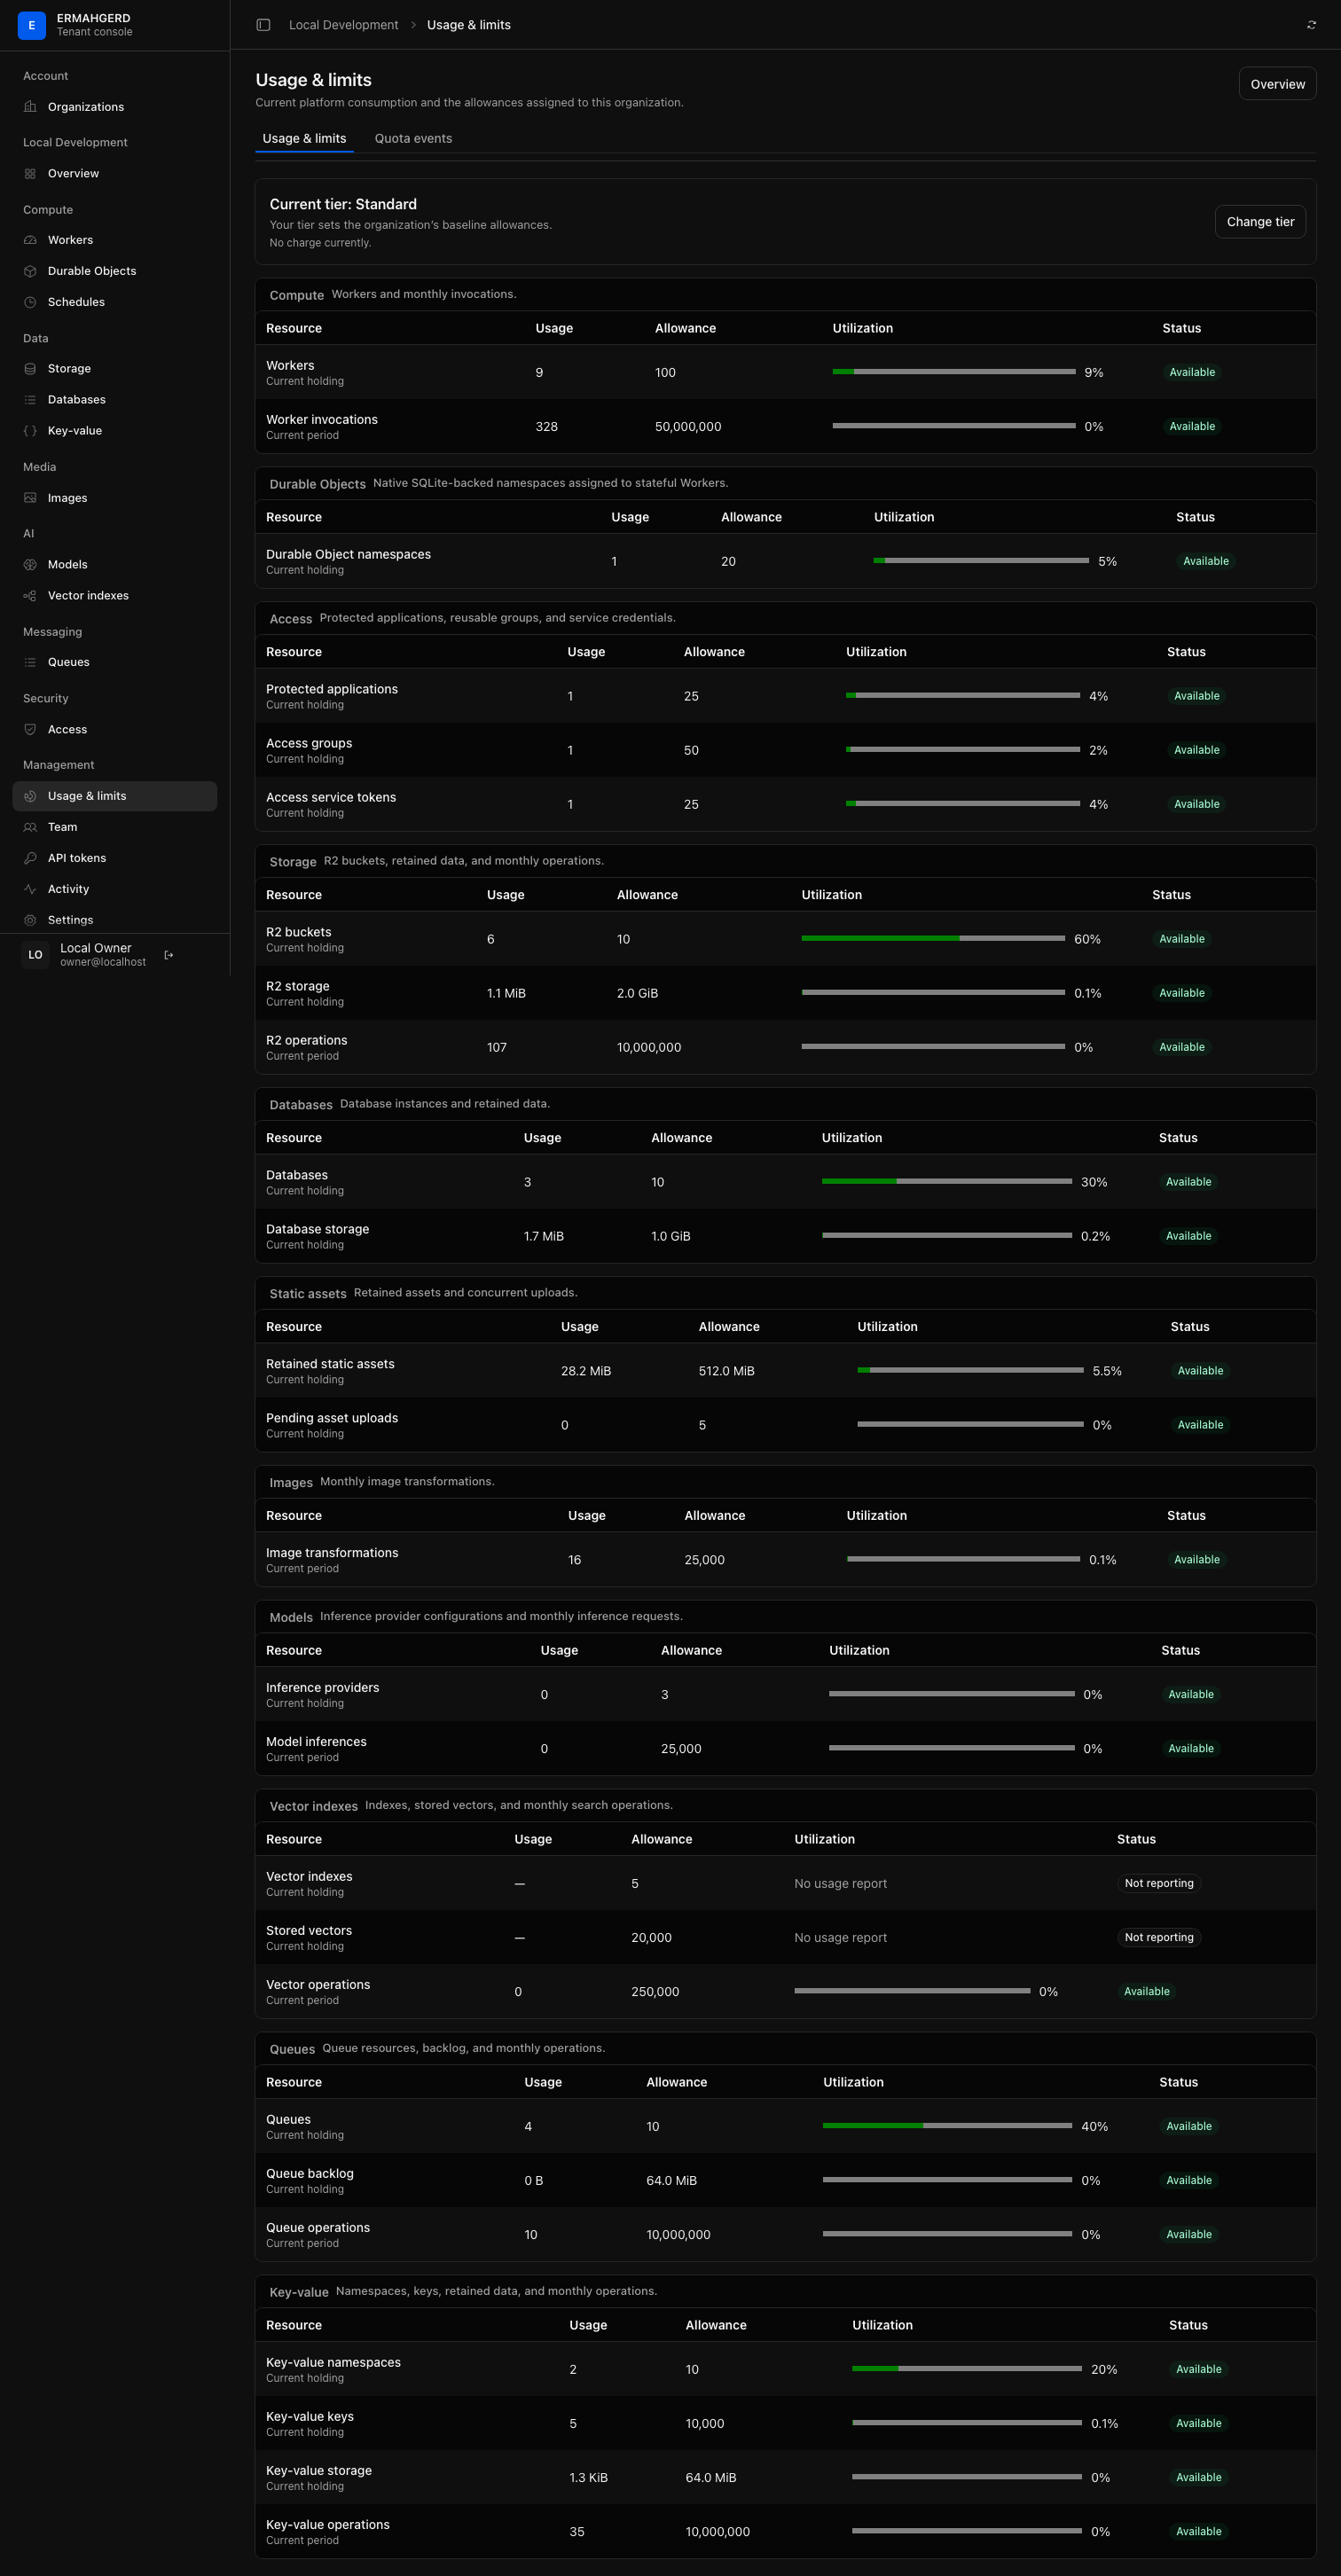
Usage & limits groups configured allowances, authoritative usage, and current enforcement state by platform service. Platform administrators can set or reset explicit allowance overrides in the administrator portal. The platform records the actor and changed values automatically; no free-form justification is required.
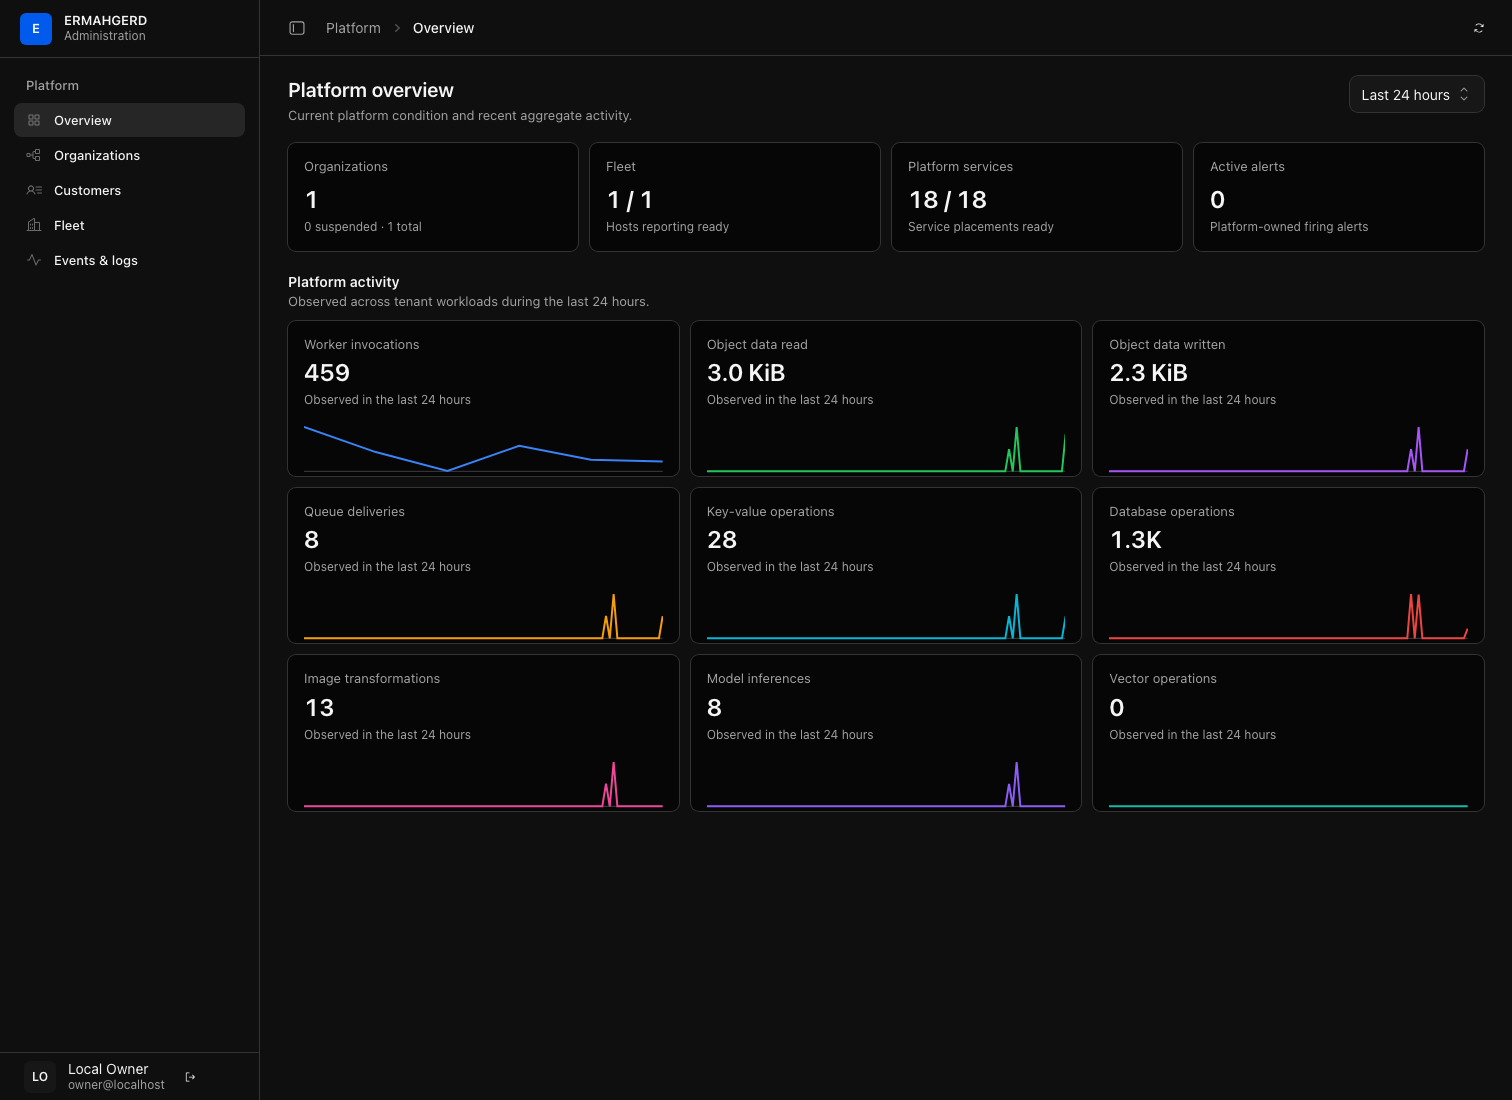
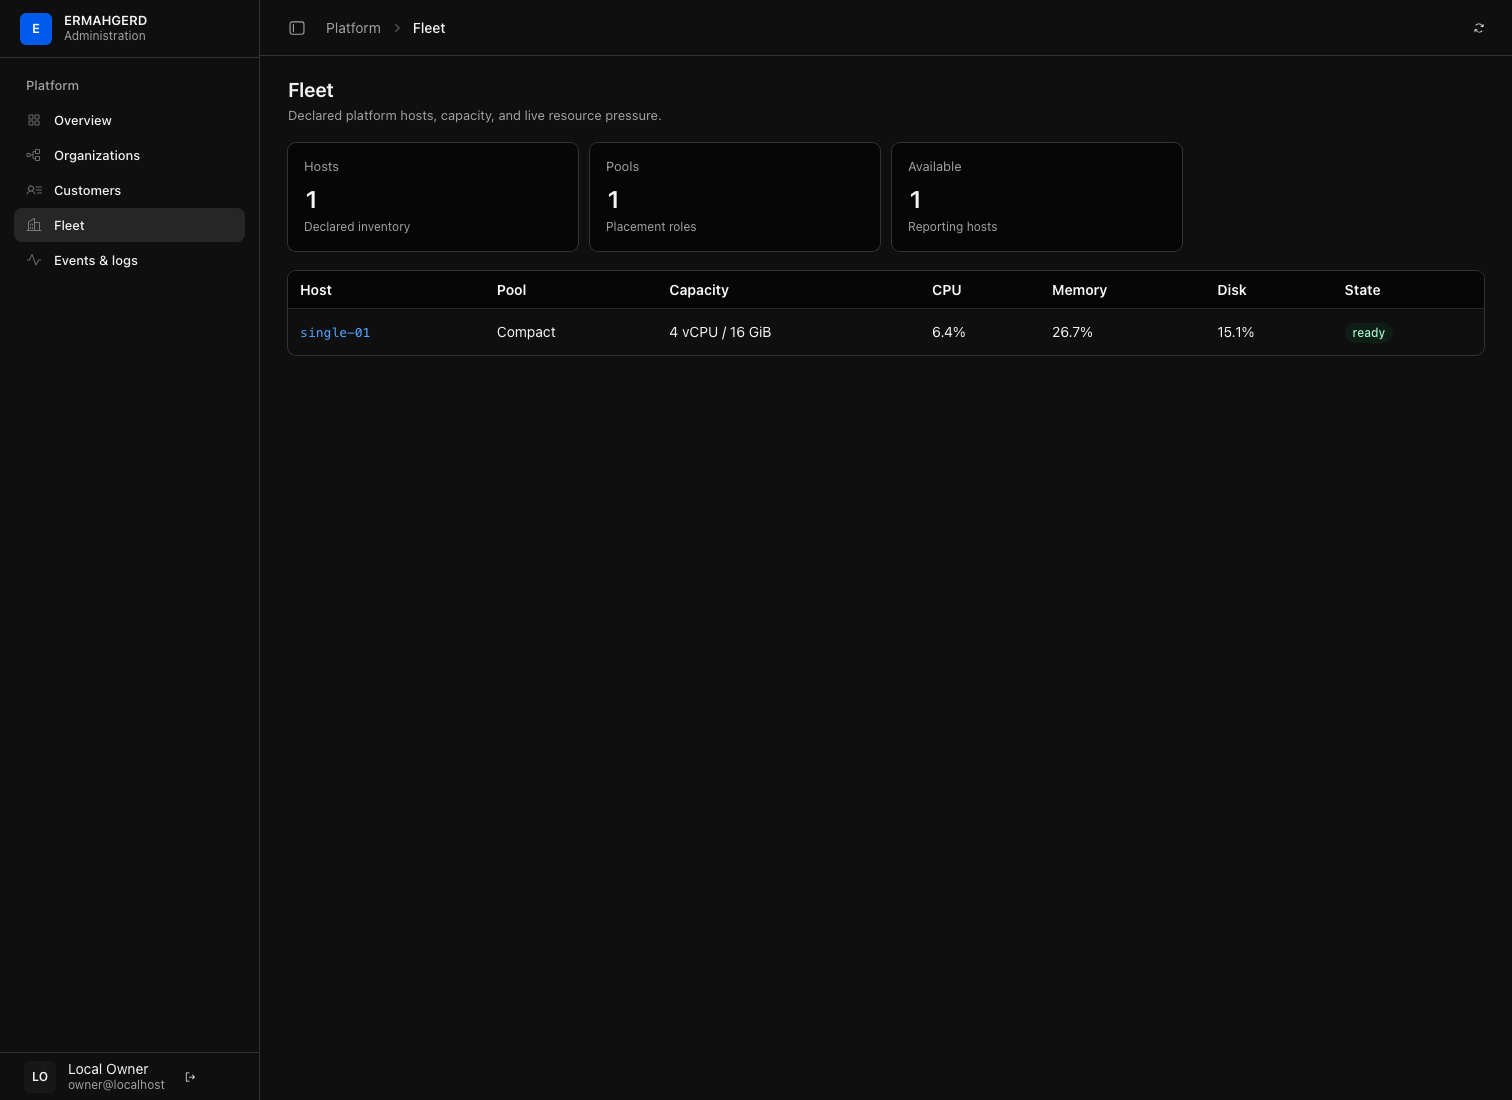
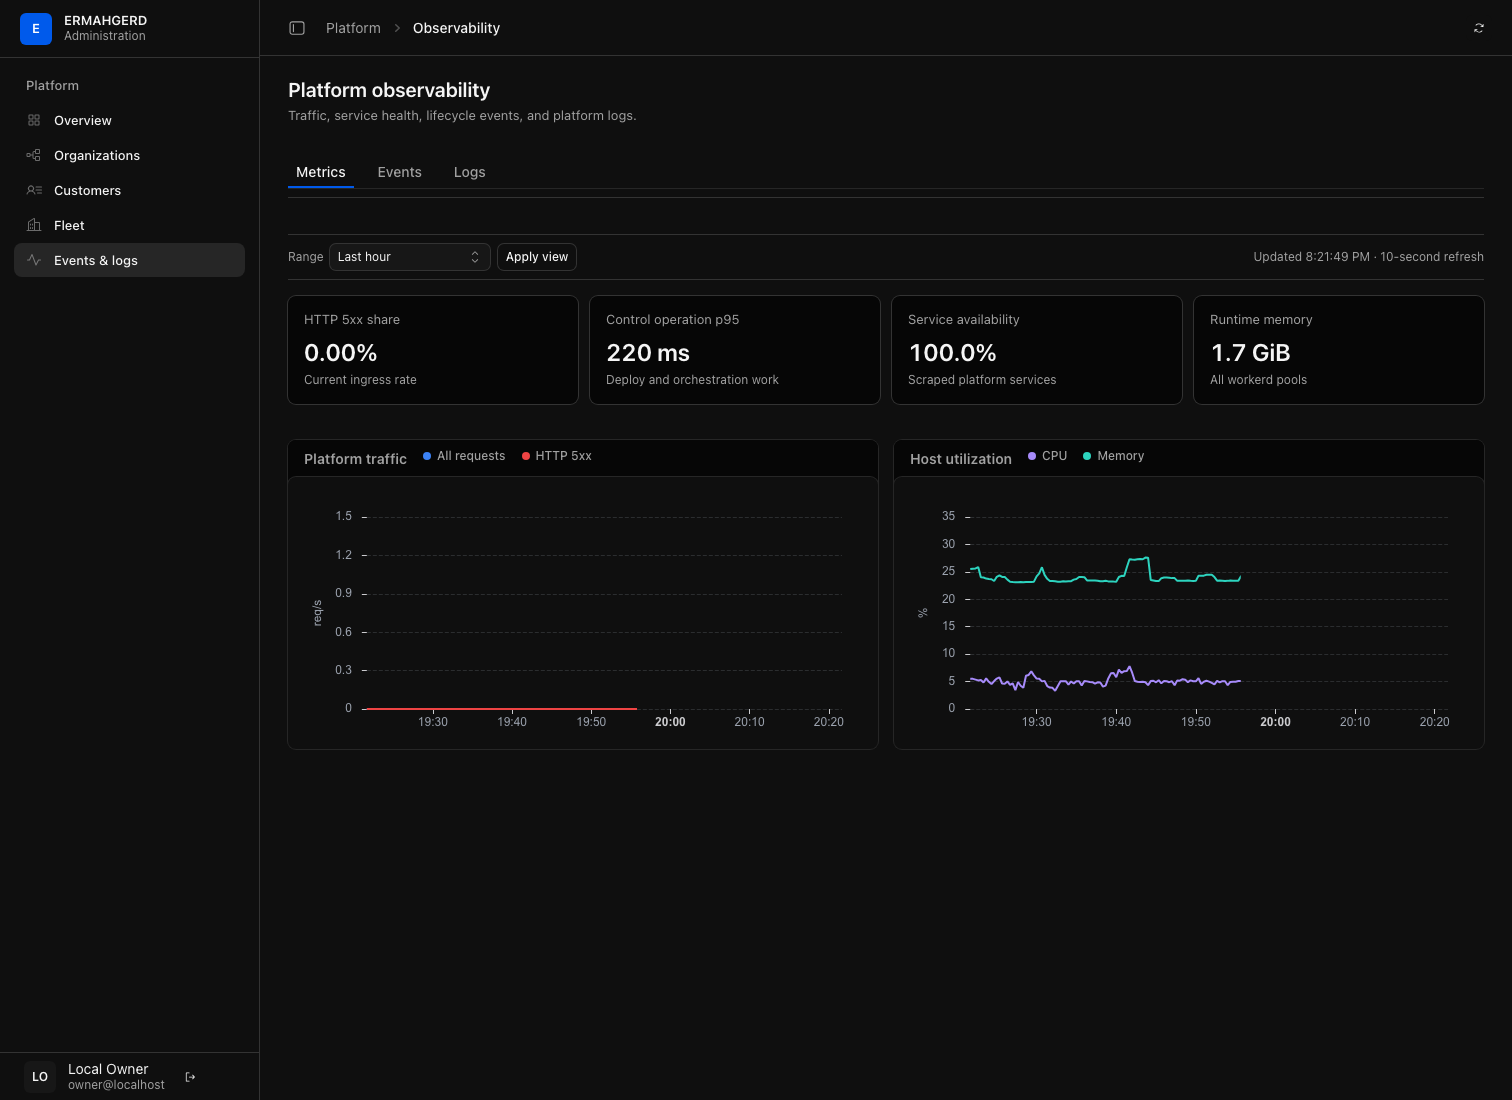
In the administrator portal, Platform → Overview summarizes platform-owned traffic and service posture, Fleet shows per-host capacity and placed services, and Events & logs exposes lifecycle evidence and selected service logs. These views deliberately exclude individual tenant failures from platform health.
Portal isolation and deployment
Ansible installs separate console processes and service accounts:
ermahgerd-landing (control WireGuard port 9073),
ermahgerd-console (control WireGuard port 9070), and
ermahgerd-admin-console (control WireGuard port 9071). Lima forwards them to
the public ingress and host loopback ports 8081 and 8082. Each authenticated
portal uses its own host-only, HttpOnly,
SameSite=Strict cookie and exact Origin checks for mutations. The tenant
listener has no platform API routes, including platform telemetry.
Identity also has separate tenant and administrator listeners. The private administrator identity API (control WireGuard port 9081) is not forwarded by Lima. Identity persists each session’s audience and rejects cross-portal use; organization API tokens remain unchanged. Upgrading from the unified console revokes old browser sessions, so sign in again after provisioning.
For an existing VM, apply the new Lima port-forward configuration before
provisioning; changing the repository template alone does not update an existing
instance. New VMs receive it automatically through make up.
For a remotely accessible installation, set console_origin and
admin_console_origin to distinct HTTPS hostnames and enable
console_cookie_secure. Expose the tenant service through the public listener;
expose the administrator service only through a private listener/VPN. Keep
identity, quotas, and other backing APIs private. Both listen addresses are
independently configurable. Hostnames alone do not provide network isolation;
the local setup does not install a VPN.
Refresh the documentation images
The images above are generated from a real, running local appliance. After
make up, refresh them with:
make docs-screenshotsThe capture only reads the appliance and replaces the curated images in
docs/screenshots/.